
Test Lab Turnaround Time: How to Measure It and How to Cut It
Author

Neerav Singh
Technical Product Specialist
Author
Neerav Singh
Technical Product Specialist
Reading Time
3 min read
Test Lab Turnaround Time: How to Measure It and How to Cut It
Search for "lab turnaround time" and page 1 belongs to hospitals. The top results discuss specimen accessioning, pneumatic tube systems and emergency physicians waiting on a blood panel. That advice suits a clinical lab. Very little of it carries over to a vehicle dynamics lab or a battery abuse cell.
A physical test lab runs on a different clock. The specimen is a seat assembly, a 400 kg battery pack or a prototype door module. Sometimes it arrives late or at the wrong revision. A fixture has to be designed and built around it. Then it competes for a shaker table that 3 programs booked for the same week. The test itself might run for 4 days. Writing and approving the report can take 9 more.
Labs usually know exactly how long a test runs. The weeks spent waiting before and after that run rarely show up in any report, and that is where turnaround time is won or lost.
This guide shows how to measure turnaround time in an engineering test lab using 6 timestamps, which metrics belong on the dashboard and 9 practical ways to bring the number down.
What turnaround time means in an engineering test lab
Test lab turnaround time is the elapsed calendar time between a lab accepting a complete test request and releasing an approved report. Every queue, handoff and hold between those 2 points counts. Execution on the rig is one slice of the total.
2 related terms often get mixed in. Lead time normally describes the customer's full wait, starting from the moment they first submit a request. Cycle time normally describes a single step, such as the hours a specimen spends on a rig. Turnaround time sits between the two and covers the portion the lab can actually influence.
The clinical playbooks transfer poorly because the work itself differs.
| Clinical lab | Engineering test lab | |
|---|---|---|
| Specimen | Blood, tissue or swab samples | Components, assemblies, prototypes and full vehicles |
| Typical test duration | Minutes to hours | Hours to several weeks |
| Common delay | Transport and accessioning | Test article arrival, fixture builds and equipment availability |
| Reporting | Largely automated result release | Engineer review, data analysis and formal sign-off |
Write your definition down before you measure anything. 2 engineers in the same lab will often start the clock at different moments, and a metric with 2 meanings produces arguments that no dashboard can settle. Decide early how to treat delays outside the lab's control. If a customer ships hardware 2 weeks late, you can pause the clock and report that pause separately. Either approach works as long as everyone applies it consistently.
Measure it with 6 timestamps
Turnaround time becomes measurable once every job carries the same 6 dates.
- T0 Request submitted: the customer or program engineer sends the request.
- T1 Scope accepted: the lab confirms the standard, sample quantity, acceptance criteria and due date.
- T2 Article ready: the test article has arrived and passed incoming inspection.
- T3 Test started: the article is mounted, instrumented and running.
- T4 Test complete: the final data point is captured.
- T5 Report released: the approved report reaches the customer.
Those dates split each job into 5 segments. Intake runs from T0 to T1. Article wait runs from T1 to T2. Readiness covers T2 to T3, which is where fixtures, equipment slots and instrumentation live. Execution spans T3 to T4. Reporting closes the job from T4 to T5.
3 formulas do most of the work:
- Lab turnaround time = T5 minus T1
- Customer lead time = T5 minus T0
- Flow efficiency = (T4 minus T3) ÷ (T5 minus T1)
Worked example
A Tier 1 supplier asks its in-house lab for a vibration test on an EV battery module. The figures below are illustrative.
| Segment | Timestamps | Days |
|---|---|---|
| Intake | Day 0 to Day 3 | 3 |
| Article wait | Day 3 to Day 11 | 8 |
| Readiness | Day 11 to Day 18 | 7 |
| Execution | Day 18 to Day 22 | 4 |
| Reporting | Day 22 to Day 31 | 9 |
Customer lead time is 31 days. Lab turnaround time is 28 days. Flow efficiency is 4 ÷ 28, or roughly 14%.
The shaker ran for 4 days. Queues and handoffs consumed the other 24. Buying faster equipment would shave hours off this job. Article wait and reporting together hold 17 days, which makes them the obvious place to start.
Metrics to put on the dashboard
| Metric | What it shows | How to calculate |
|---|---|---|
| Median TAT by test type | The typical customer experience | Middle value of T5 minus T1 for jobs completed in the period |
| 90th percentile TAT | How long the slow jobs take | Value that 90% of completed jobs fall at or below |
| On-time delivery rate | Reliability of commitments | Jobs released by the committed date ÷ all jobs released |
| Flow efficiency | Share of time spent testing | Execution days ÷ lab TAT |
| Queue age | Early warning of slippage | Days each open job has spent in its current segment |
| Re-test rate | Rework hidden inside TAT | Jobs needing a repeat run ÷ jobs completed |
| First-pass report approval | Reporting quality | Reports approved without revision ÷ reports submitted |
Test durations in engineering labs are heavily skewed. One 1,000 hour durability run can drag an average far away from what most customers experience. The median shows the typical job. The 90th percentile exposes the tail that generates escalations.
Report every metric by test type as well. A 2 hour tensile pull and a 6 week corrosion cycle belong in separate rows.
9 ways to cut test lab turnaround time
1. Freeze scope at intake
Incomplete requests quietly stall jobs. A request missing the governing standard, sample quantity or pass criteria starts an email thread and the job waits until someone replies. Use a structured request form that cannot be submitted until mandatory fields are complete. Assign a named reviewer and target 2 working days from T0 to T1. Track how often requests bounce back for clarification to see which programs need a better template.
2. Gate scheduling on article readiness
Reserving a chamber before the test article exists creates phantom bookings that block other work and collapse at short notice. Make article receipt and incoming inspection a hard gate. A slot becomes firm only after T2 and stays tentative and visible to other users until then. Programs learn that late parts move their date and the lab stops holding capacity for hardware still in transit.
3. Schedule against real constraints
A job needs a qualified technician, the right fixture, a data acquisition system with enough channels and equipment within its calibration window. Spreadsheet schedules usually track 1 of these and assume the rest, which is the core of the test scheduling problem in most labs. Plan against all constraints together so conflicts appear at planning time.
4. Prepare fixtures and instrumentation in parallel
Setup often takes longer than the test itself. Fixture design, machining, strain gauge installation and channel checks can take a week. Start this work once scope is accepted so it overlaps with the article wait. A fixture library with reusable adapters and documented setup notes turns repeat builds into quick retrievals. Photograph each approved setup and attach it to the test method for the next technician.
5. Protect calibration and maintenance windows
An expired calibration found on test day or a pump failure from a missed service forces a reschedule that ripples through the queue. Put calibration due dates and preventive maintenance on the same calendar as test bookings. Keep service history and certificates attached to each asset so the calendar stays reliable.
6. Verify setups before the clock runs
A re-test doubles execution time and often resets readiness too. Most repeats come from preventable errors such as a mismapped channel, an out-of-spec torque value or a skipped preconditioning step. A short pre-test checklist signed by a second person catches many of these. Log each re-test with a root cause code and fix the recurring mistakes that surface after a quarter.
7. Capture data in a report-ready structure
Reporting is often the longest segment after execution. Capture data, photos and observations against the job record during the test and use templates that pull those fields directly. Draft the setup description and equipment list during readiness so only results and conclusions remain at the end.
8. Put a timer on approvals
Finished reports can wait days because the approver does not know they are pending. Set a review service level, route each report to a named approver and display aging reports on a shared view. A report stuck for 3 days deserves the same attention as a machine down for 3 days.
9. Review turnaround weekly by segment
Monthly averages hide what matters. Run a 20 minute weekly review of median and 90th percentile TAT by test type, the 5 oldest open jobs and where each is stuck. Choose 1 improvement per month and measure its effect on the segment it targets.
A 4-week plan to get a baseline
| Week | Focus | Output |
|---|---|---|
| 1 | Agree the 6 timestamp definitions and clock-stop rules | A 1-page TAT definition signed off by the lab manager |
| 2 | Pull T0 to T5 dates for the last 50 completed jobs | A baseline spreadsheet with missing dates flagged |
| 3 | Calculate median, 90th percentile and flow efficiency by test type | A segment breakdown showing where time accumulates |
| 4 | Choose the largest segment and pilot 1 lever from the list above | A target and a date to re-measure |
Expect gaps in week 2. Missing timestamps are a finding in their own right, because a segment you cannot measure is a segment nobody manages.
How TITAN helps labs cut turnaround time
TITAN is a test lifecycle management platform built for physical engineering test labs across automotive, aerospace, defense and consumer electronics. Every job moves through request, scheduling, execution and reporting inside one record. The 6 timestamps in this guide get captured as the work happens, so nobody has to rebuild them from email threads at month end.
That single record changes how each segment behaves. Requests arrive through a structured portal that holds them until mandatory fields are complete. Planners book rigs knowing whether the test article has passed inspection and whether the equipment is inside its calibration window, because TITAN schedules people, equipment and facilities together. Data and photos logged during the test feed the report template directly, which shortens the gap between T4 and T5.
Lab managers can then read turnaround by segment and test type on the TITAN KPI dashboard. The weekly review from lever 9 becomes a 20 minute conversation about live numbers.
Ready to Reduce Test Lab Turnaround Time?
Bring test requests, scheduling, execution into one connected workflow with TITAN.
Recent Blogs

Beyond Go-Live: How Labs Mature on TITAN
A 2020 Boston Consulting Group study found that 70% of digital transformations miss their objectives, leaving just 30% that deliver
Read more...

THOR-50M vs Hybrid III: A Reference Comparison
Put a THOR-50M and a Hybrid III 50M through the same frontal crash test and they will tell you different stories about
Read more...

Developmental Test and Evaluation: The Discipline That Decides Whether a Program Is Actually Ready
A brake controller program carries 312 verification line items across 4 development builds. Build 3 closes 287 of them.
Read more...

What Flight Test Management Covers
A certification campaign on a business jet clears 240 test points across 38 sorties. On sortie 22 the instrumentation
Read more...

The Real Cost of an Idle Test Rig
A 4-post hydraulic durability rig carries a replacement value north of $2 million. An environmental chamber rated for combined
Read more...
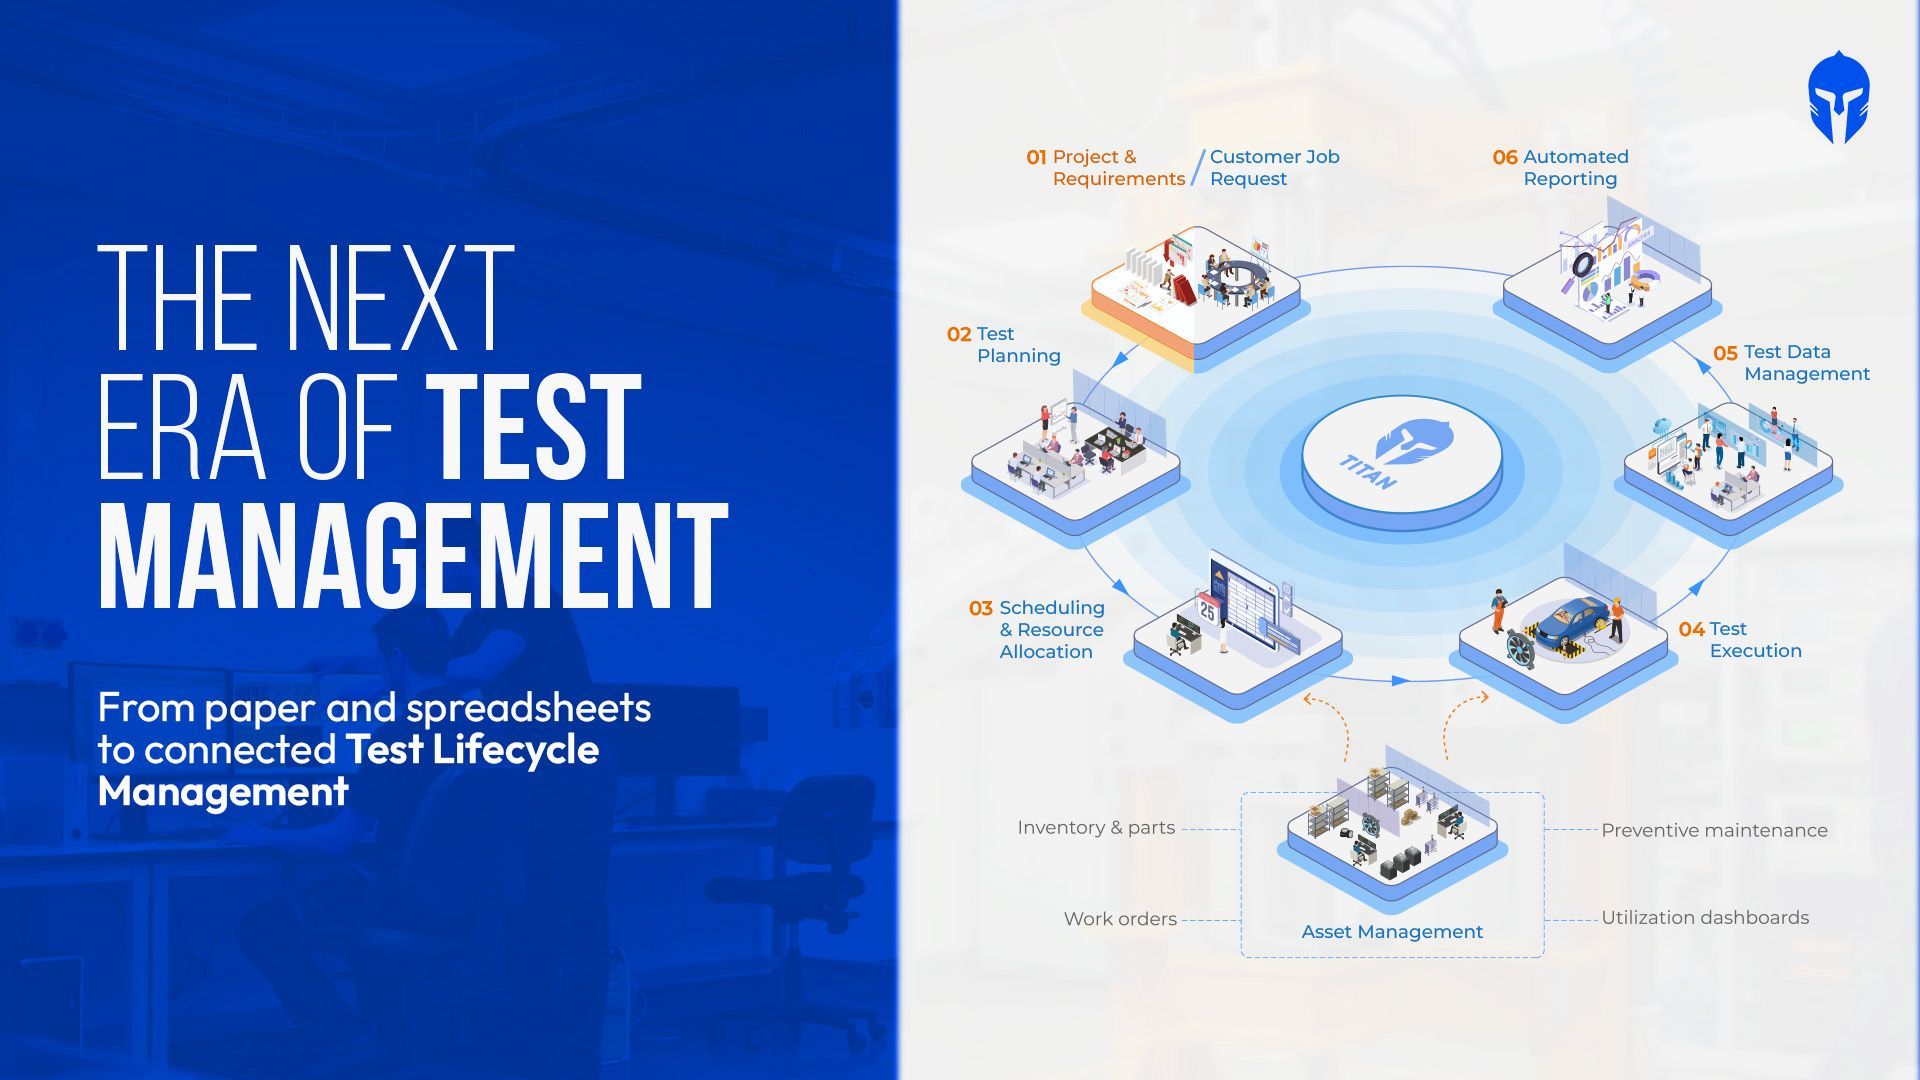
The Evolution of Test Management Tools
Type "test management tools" into a search bar and you get 2 unrelated answers. One set of results covers Jira integrations
Read more...

How to Maintain ISO 17025 Accreditation in Aerospace Testing Labs
It starts with a simple audit question: “Can you show me the calibration record for the equipment used in that test?”
Read more...
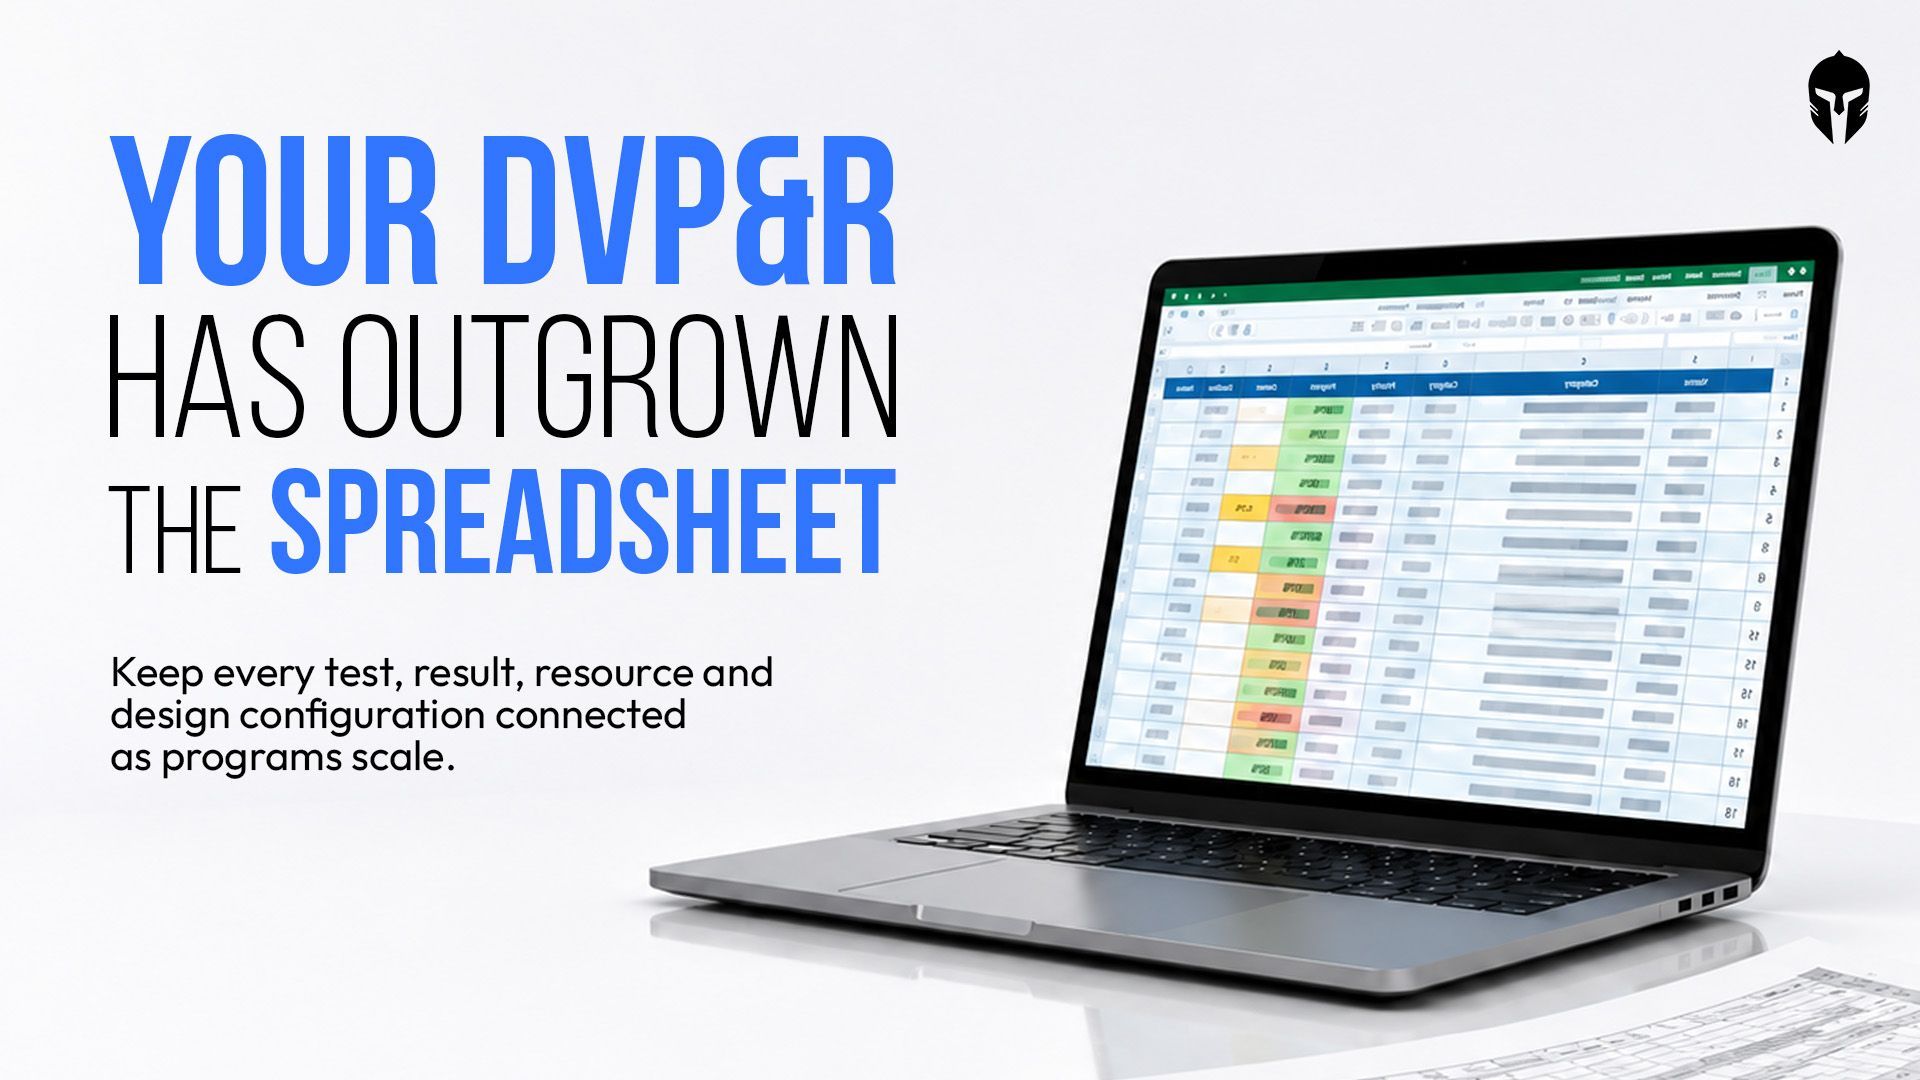
Most DVP&R Processes Collapse Before the First Test Even Runs. Here's Why
At some point, the DVP spreadsheet becomes a source of questions instead of answers. Which test count is current?
Read more...
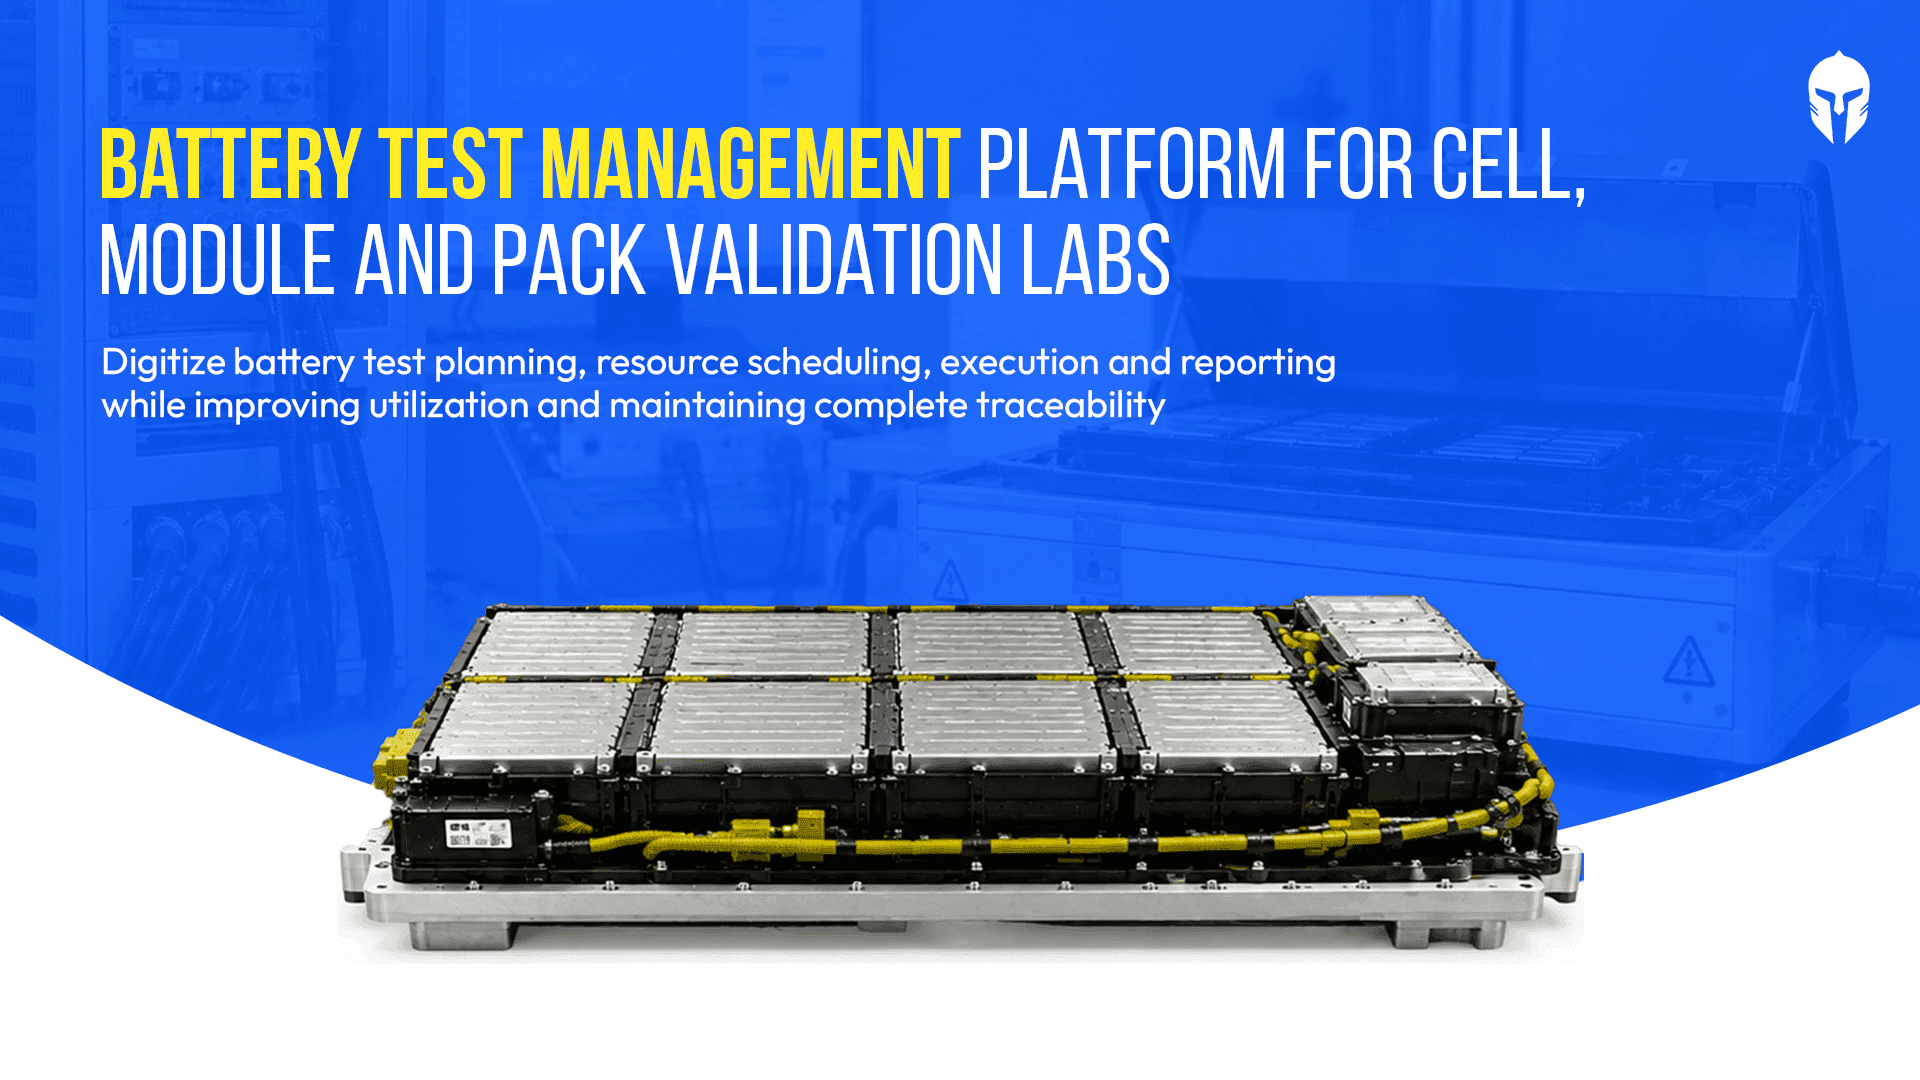
Battery Test Management: How High-Volume Cell, Module and Pack Labs Stay in Control
Weeks into a battery cycle life test, the details start to accumulate: thousands of charge-discharge cycles,
Read more...
What Is a LIMS? A Complete Guide to Laboratory Information Management Systems
Test requests arrive. Samples or test articles need to be identified. Equipment has to be available and calibrated.
Read more...
Vibration Testing Management: From Shaker Scheduling to Test Reports
Every vibration test bay runs on a simple ledger. Hours available on the shaker minus hours testing equals hours lost and eac
Read more...

Euro NCAP 2026: Inside the Operational Challenge for Test Labs
Euro NCAP 2026 puts a different kind of pressure on the test lab calendar. More safety functions need to be validated across more scenarios, with the right vehicles,
Read more...

UAV Testing : Following the Traceability Chain of a Single Aircraft
Somewhere in a UAV qualification programme, a seemingly simple traceability question can become unexpectedly expensive.
Read more...

Faster Automotive Development Starts with Better Test Operations
Modern vehicle programs generate an enormous volume of validation activities, test data, schedules and engineering decisions.
Read more...

How Crash Test Dummies Changed Automotive Safety
In the late 1940s an Air Force flight surgeon named John Stapp noticed a grim pattern. More of his pilots were dying in cars than in planes.
Read more...
Test Management for Component Manufacturers: How to Run Multi-Customer Validation Without Losing Control
Your lab validates parts for more than one customer. Each OEM arrives with its own requirements, its own report format
Read more...

Stop Testing in Isolation: 4 Surprising Lessons from the Ground
Walk into almost any physical test lab and you will find smart people doing careful work inside their own four walls.
Read more...
Why Automotive Testing Labs Need More Than LIMS
When engineers at an automotive testing lab search for software to manage their operations, they often land on LIMS.
Read more...
Gantt Chart or Timeline? Picking the Right View for Test Project Management
You open your scheduling tool on a Monday and the program looks healthy. Every test sits inside a neat colored bar
Read more...
7 Critical Problems with Manual Test Tracking in Engineering test labs
Despite advances in engineering software, many product validation teams still rely on spreadsheets, shared drives and email
Read more...

Test Planning Best Practices: How TITAN Simplifies Test Plans, Milestones and Coverage
Ask a validation lead in any physical product test lab how their test plan started and you will hear about a spreadsheet.
Read more...
What Are Electronic Lab Notebooks? A Test Lab View
An electronic lab notebook (ELN) replaces the paper notebook used to record experiments, tests, and observations.
Read more...
The Complete Guide to Test Lab Management in 2026
Test labs have become one of the most constrained resources in modern product development. Validation timelines are shrinking
Read more...
A Test Planner's Guide to Hardware Validation
Hardware testing sits at the center of every reliable product program. For test planners, the work goes well past
Read more...
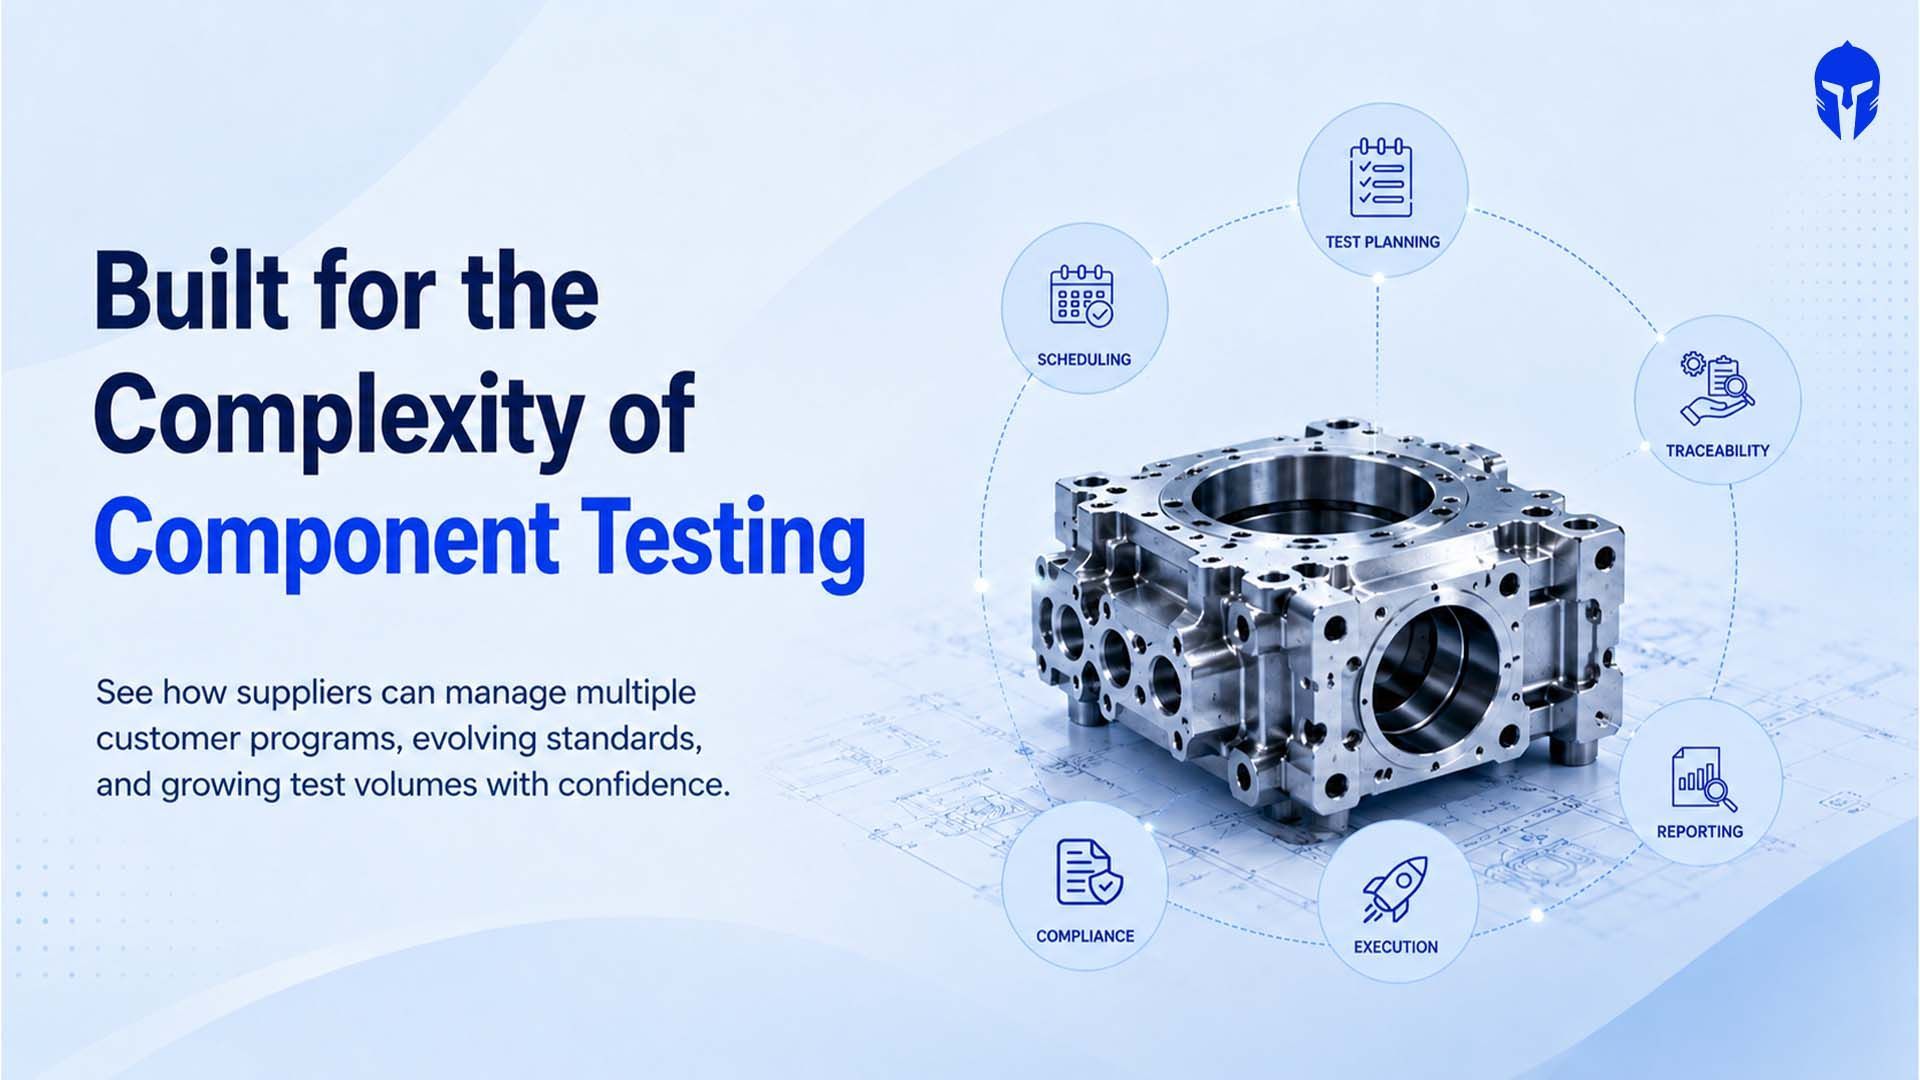
Why Component Suppliers Are Rethinking Test Lifecycle Management
The global automotive material and component testing market reached roughly US$26.91 billion in 2025 and is on track
Read more...
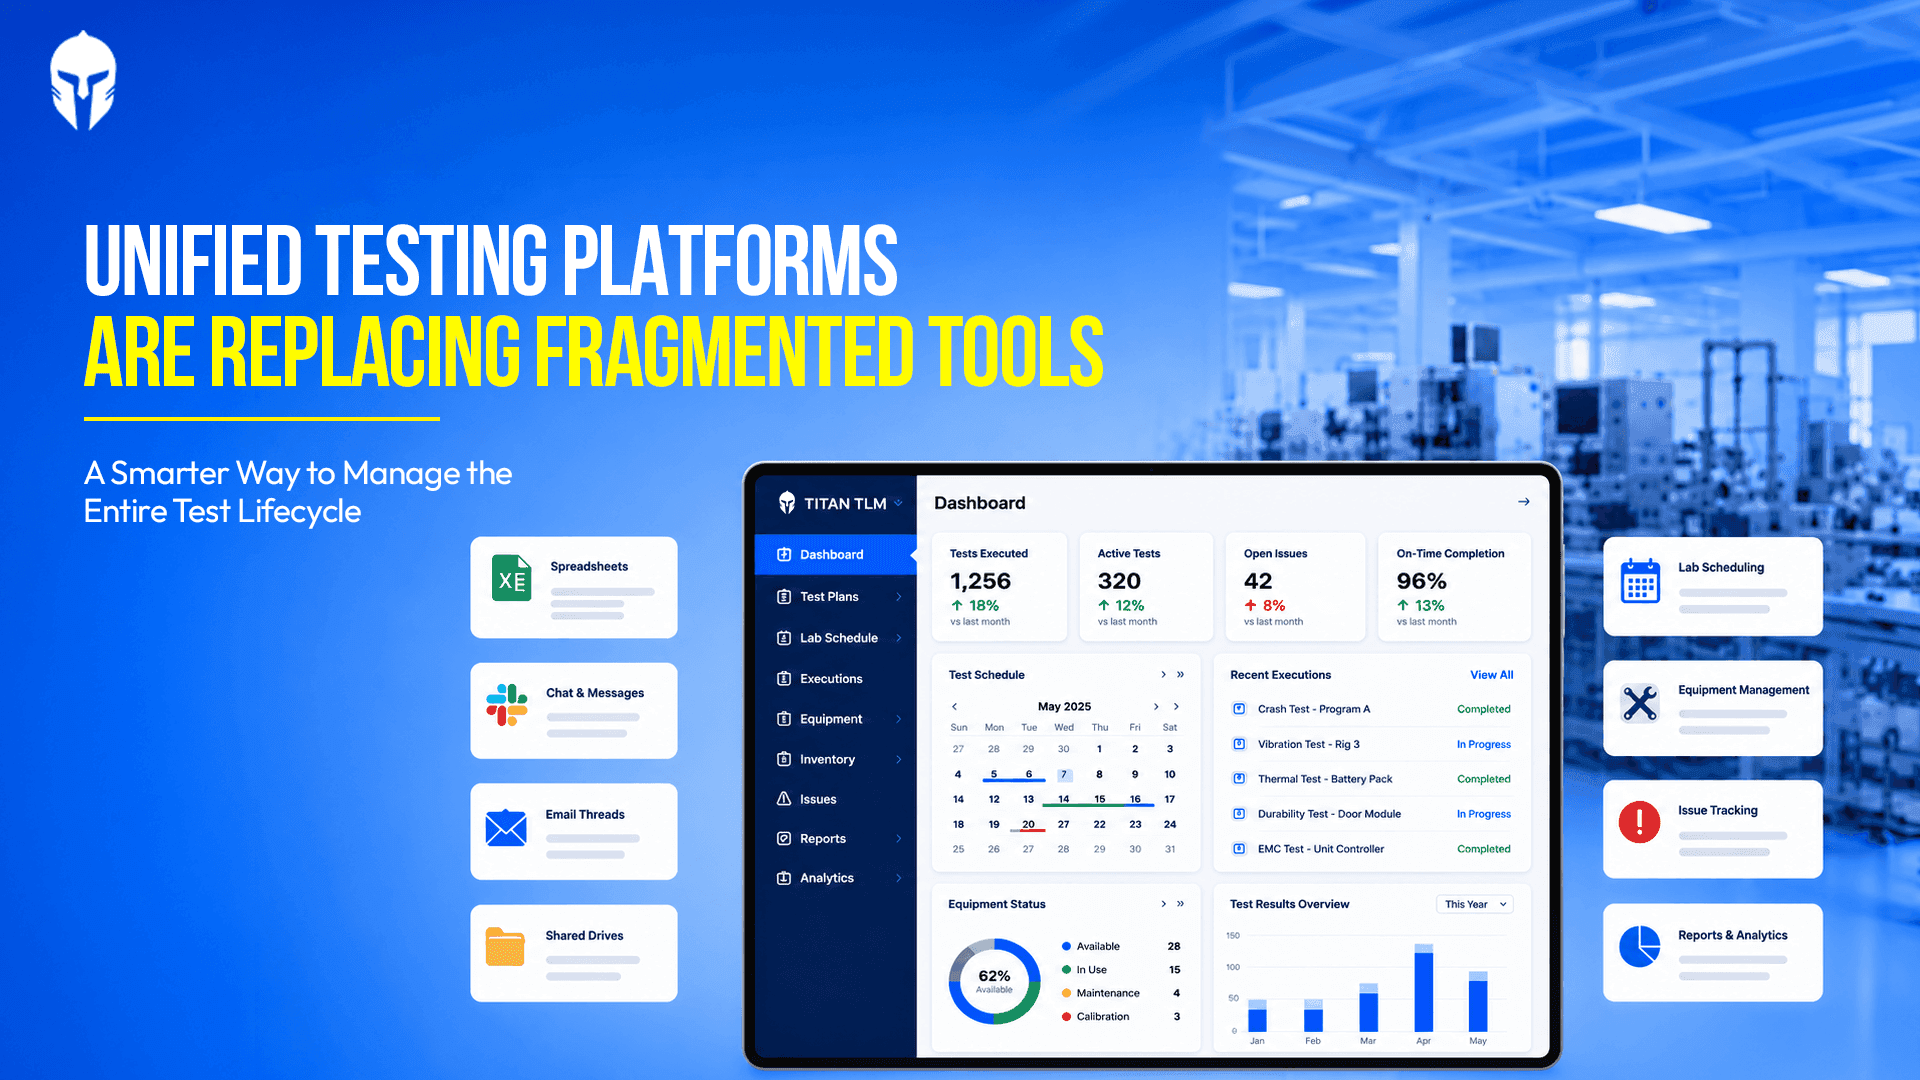
Advantages of using a Unified Testing Platform Over Fragmented Testing Tools
Ask anyone who runs a physical test lab what their week looks like and you will hear a familiar story. The test plan lands
Read more...
The Next 5 Years of Physical Product Testing: A Prediction from the Industry Floor
A product engineer at a mid-size EV components manufacturer spent 14 weeks getting a battery module through
Read more...

How TIC Labs Can Manage Growing Test Volumes Without Losing Operational Control
The Europe Testing, Inspection and Certification (TIC) market is on a sustained growth path. Valued at USD 58.93 billion in 2025
Read more...

The Ultimate Guide to Automotive Crash Testing
Every vehicle on the road today carries the invisible fingerprint of crash testing. Before a single unit reaches a customer,
Read more...

How Leading Chassis and Powertrain Teams Are Closing the Test Traceability Gap
The launch of a dedicated chassis and powertrain testing focus at Vehicle Tech Week North America 2026
Read more...

Premium Wake Boats and the New Rules of Marine Product Testing
Premium watersports boats have become among the most mechanically complex products in recreational manufacturing.
Read more...

What Euro NCAP's 2026 Truck Safety Results Mean for Commercial Vehicle Test Programs
Euro NCAP's 2026 truck safety assessment delivered a landmark result: five out of seven vehicles in the Regional Distribution category
Read more...

A Practical Guide to Choosing and Implementing a Laboratory Information Management System (LIMS)
If you're still running your lab on a combination of spreadsheets, handwritten logs and shared folders with names
Read more...

What -30°C teaches you about a tire
In northern Finland, engineers listen to rubber meet ice in silence so complete it feels deliberate. What they're really chasing consistent
Read more...
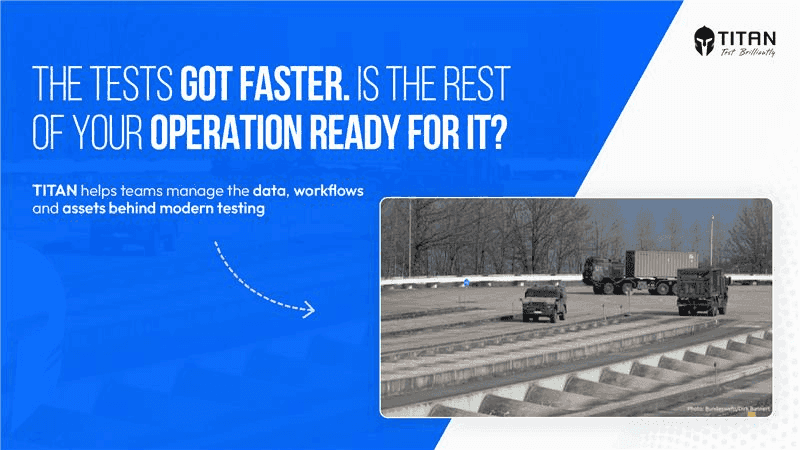
When Robots Take the Wheel: What the Bundeswehr's Driverless Testing Shift Means for Modern Test Operations
Germany's Bundeswehr operates the Technical Centre for Land-Based Vehicle Systems (WTD 41) in Trier, a facility whose sole mandate is to ensure
Read more...
5 Questions Every VP of Engineering Should Ask About Their Test Operations
There's a particular kind of silence that falls over a lab when something goes wrong late in the testing cycle. Not the silence of focus or concentration. A heavier kind. The kind that settles
Read more...
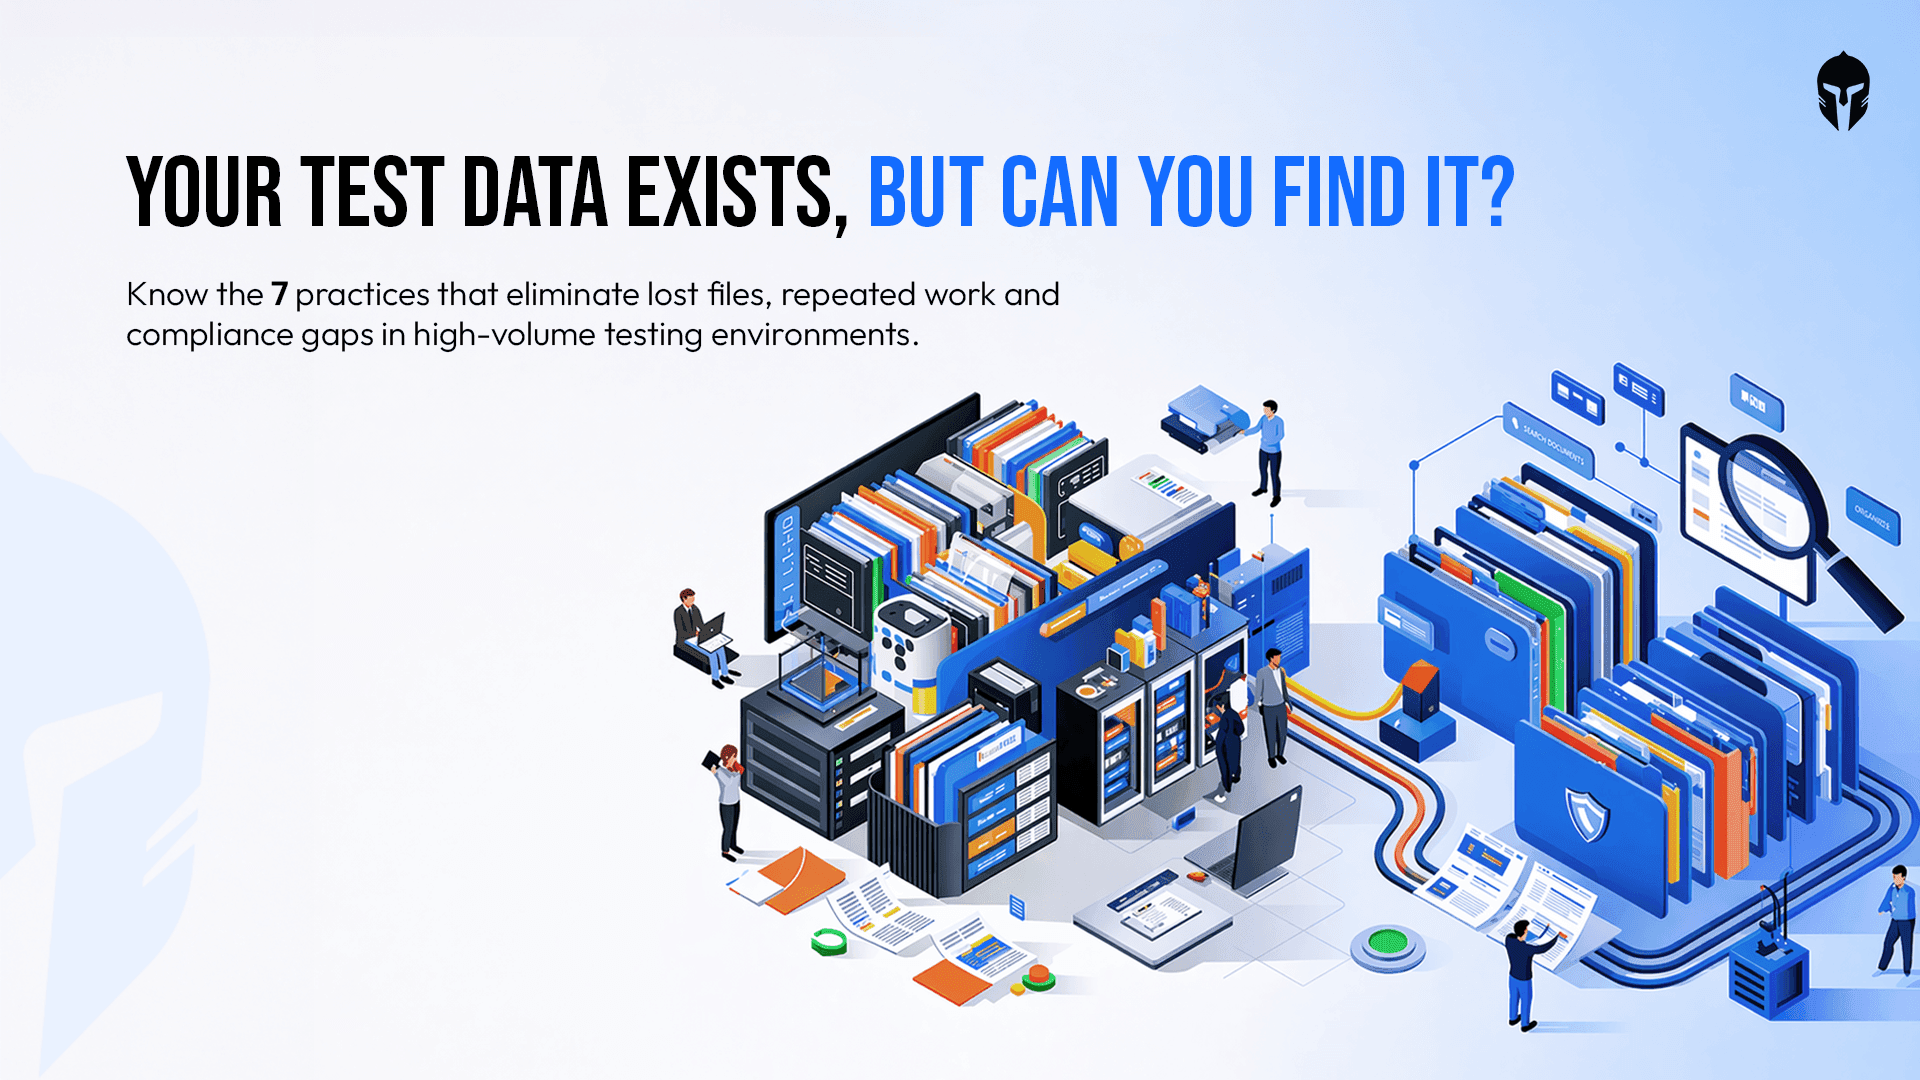
Test Data Management: Best Practices for High-Volume Labs
In a high-volume R&D lab, data is everywhere and that's exactly the alarming problem. Test files, equipment logs, video recordings, structured forms, raw observations
Read more...
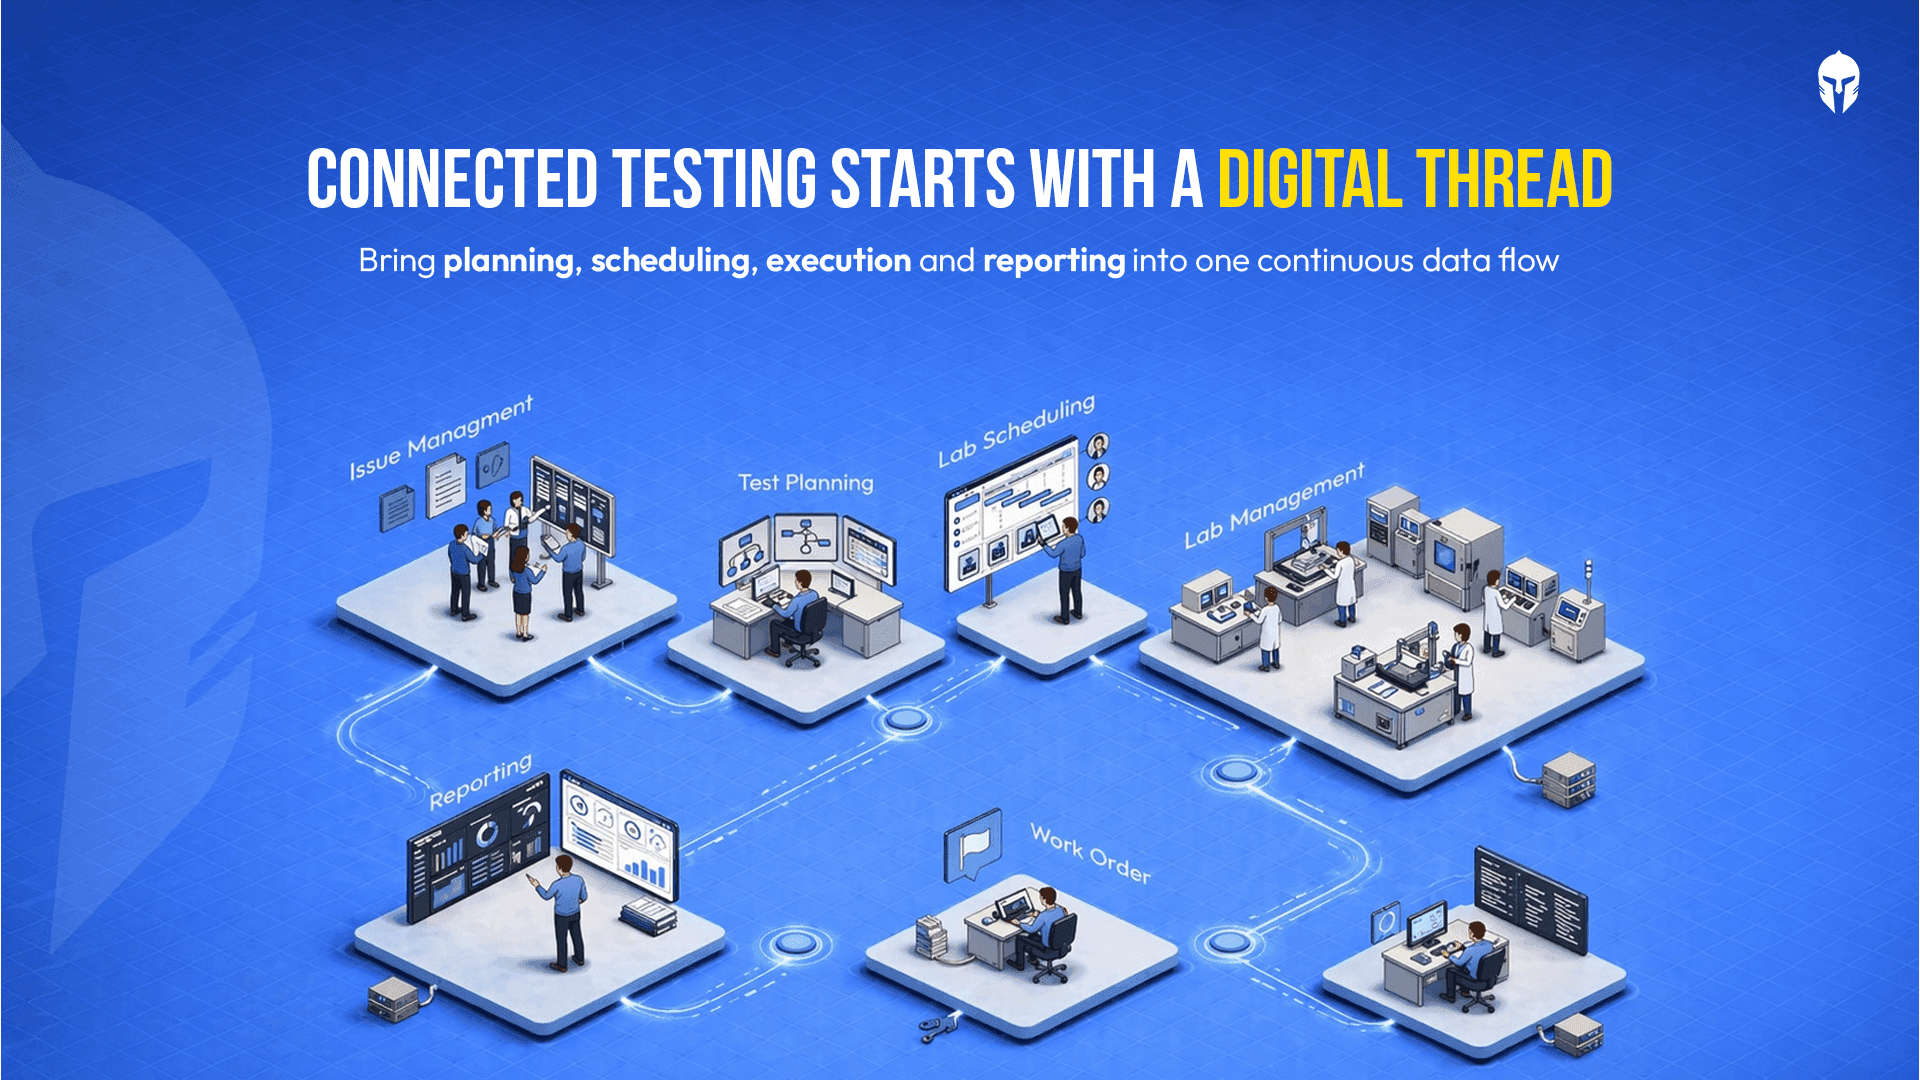
Digital Thread in Physical Product Testing: Hype or Reality?
There is a phrase circulating in engineering circles that sounds almost too good to be true: the digital thread. A single, continuous digital data backbone that connects every phase
Read more...
How Proving Grounds Are Going Digital in 2026
Proving grounds have always been the backbone of vehicle validation. Tracks get booked, prototypes get tested, drivers get scheduled and data gets collected.
Read more...
Paper Records vs. LIMS: Choosing the Right Data Management Strategy for Your Lab
For decades, paper-based record keeping was the backbone of laboratory operations. Binders stacked on shelves, handwritten test logs, manually updated calibration sheets;
Read more...
TITAN as The Inventory Management Platform
Running a modern testing or R&D lab without a reliable inventory management system is like navigating without a map. Equipment runs out mid-experiment. Critical spare
Read more...
AI in Test Scheduling: Six Use Cases Worth Watching
Test scheduling looks administrative from the outside. Inside an engineering lab, it is one of the most layered coordination problems a team faces and one of the
Read more...
What Every Role in Your Test Lab Needs from One Platform
Running a hardware test lab means managing a constant flow of moving parts, schedules, resources, personnel, data or deadlines. When that flow is smooth,
Read more...

Implementing ALCOA in Your Lab: Gaps, Best Practices and What Good Looks Like
In the previous blog, we covered what the ALCOA principles are and why they apply to engineering and testing laboratories every bit as much as they do to pharmaceutical manufacturing.
Read more...

Why ALCOA Is Not Just a Pharma Principle: What Engineering and Testing Laboratories Need to Know
When most professionals hear the term ALCOA, they think of pharmaceutical manufacturing, clinical trials or FDA-regulated environments. That association is understandable, the ALCOA
Read more...

What Is a Design Verification Plan (DVP)? A Practical Guide for Test Engineers
Design Verification Plans (DVP) sit at the heart of any product development program. They define what gets tested, when, how and to what standard.
Read more...
The Test Scheduling Problem Explained
Ask any test engineer what slows down a program and you'll hear the usual answers. Equipment failures. Scope changes. Resource shortages.
Read more...

Home Grown Tools vs TITAN
That internal tool your team built seven years ago. It was genuinely impressive at the time. Someone on the team had a problem; nobody had a budget for a proper solution
Read more...

3 Questions Your Dashboard Should Answer Instantly
There's a framework in operations management that measures any operation across four dimensions - Volume, Variety, Variation and Visibility.
Read more...
How Smart Scheduling Is Beating Million-Dollar Equipment Investments?
You invested heavily in advanced equipment because precision matters. Calibration matters. Speed to market matters. Yet despite those investments,
Read more...
Crash Test Dummies Aren’t Props, They’re Precision Instruments
Step into a contemporary crash testing facility and one thing becomes clear almost immediately.
Read more...
OEM and the Hidden Cost of Fragmentation: Why Test Lifecycle Management Matters?
Picture a weekly sync inside an automotive OEM program, their verification and validation (V&V) teams racking their brains over spreadsheets.
Read more...
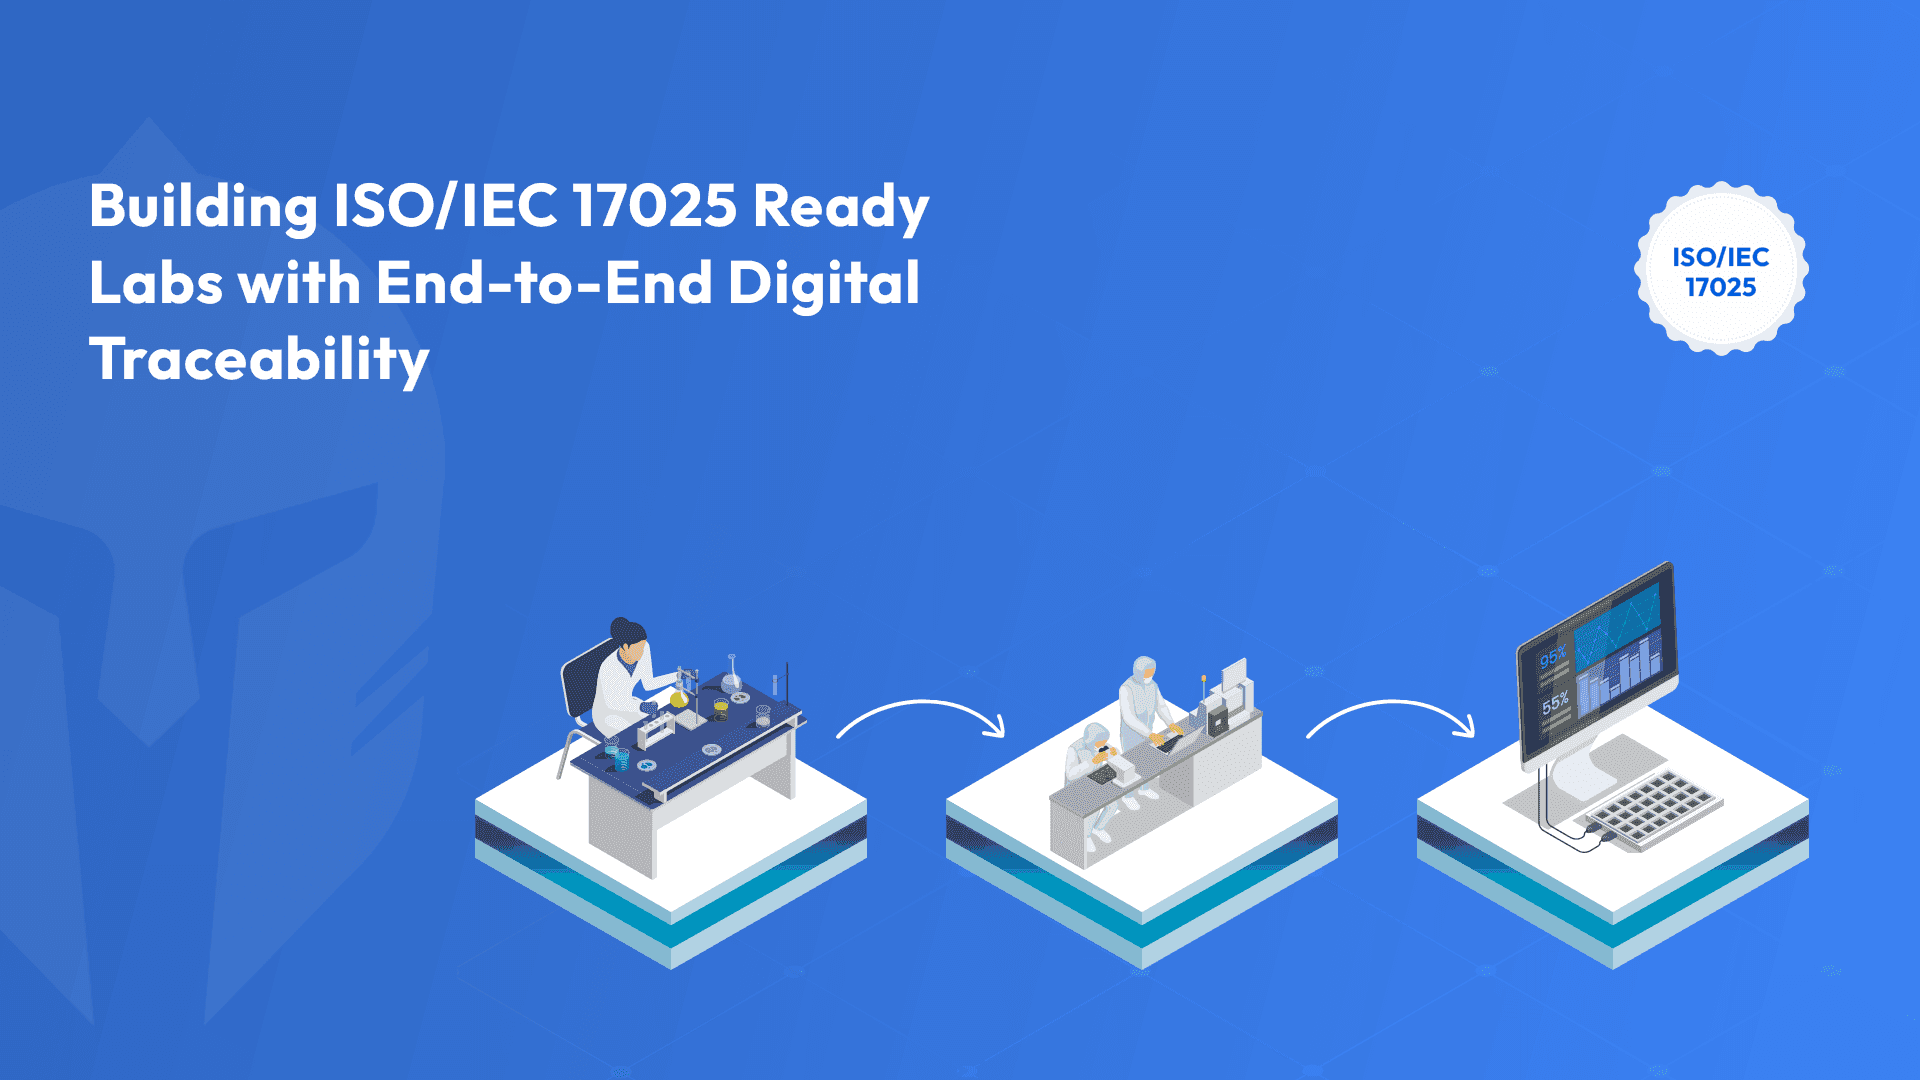
How Do You Build ISO/IEC 17025 Ready Labs with End-to-End Digital Traceability?
If you run or work with testing and calibration laboratories whether as an OEM lab, an independent testing facility
Read more...

Any Ambition Bigger Than a Spreadsheet?
Imagine this: It's late on a Friday evening, and Sarah, a dedicated vehicle test engineer at a leading R&D organization,
Read more...
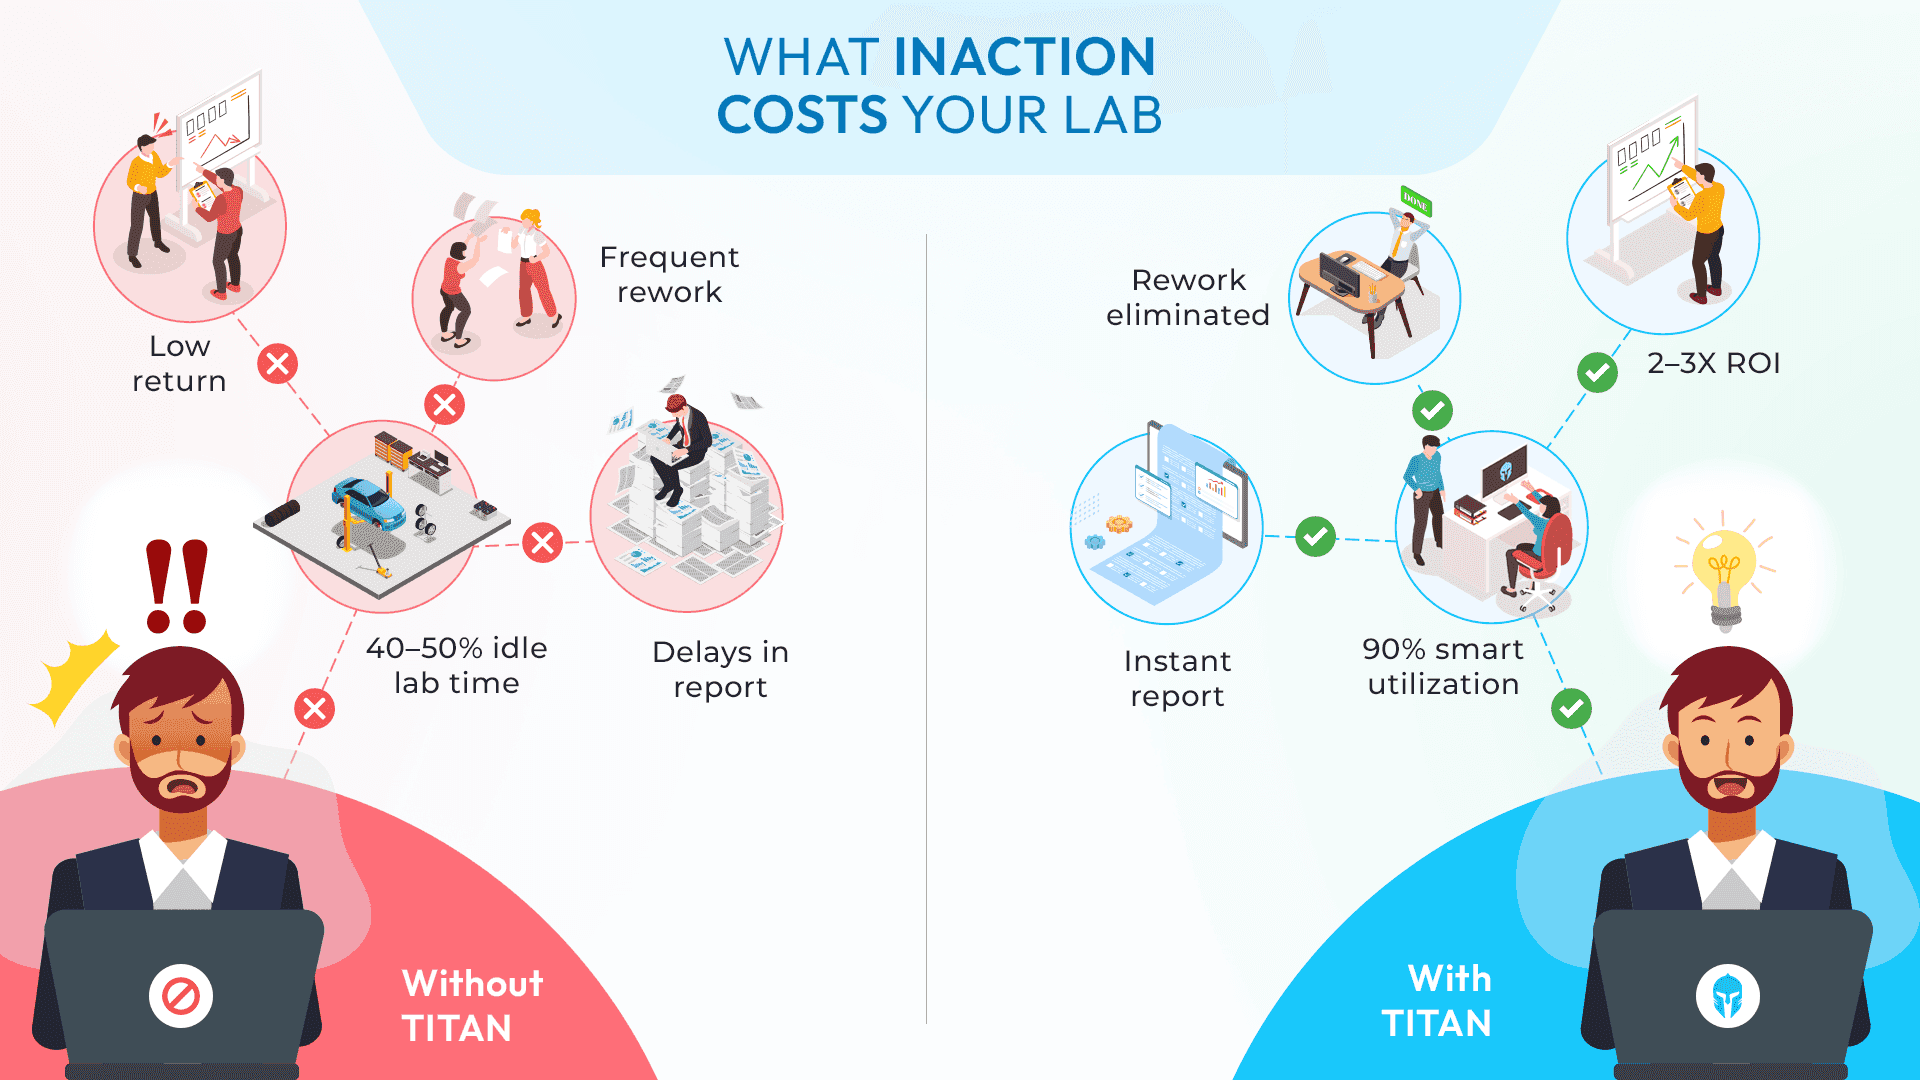
The Cost of Inaction: Why Testing Teams Can't Afford to Delay a Test Lifecycle Management Solution
Many engineering leaders already know their testing teams need a centralized system. The challenge?
Read more...
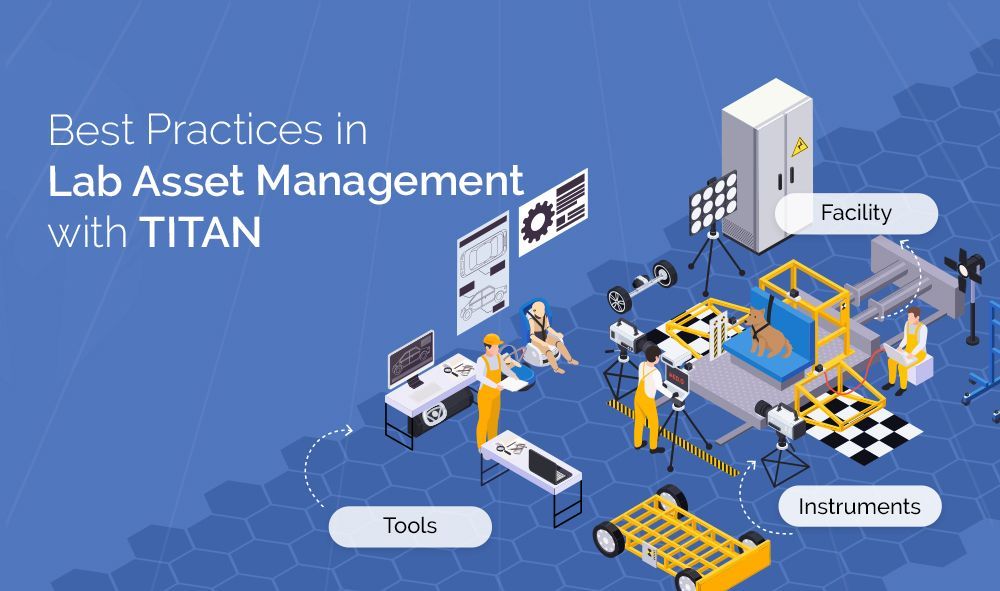
Best Practices in Lab Asset Management with Titan
Modern laboratories operate under constant pressure: deliver accurate results faster, manage rising costs,
Read more...
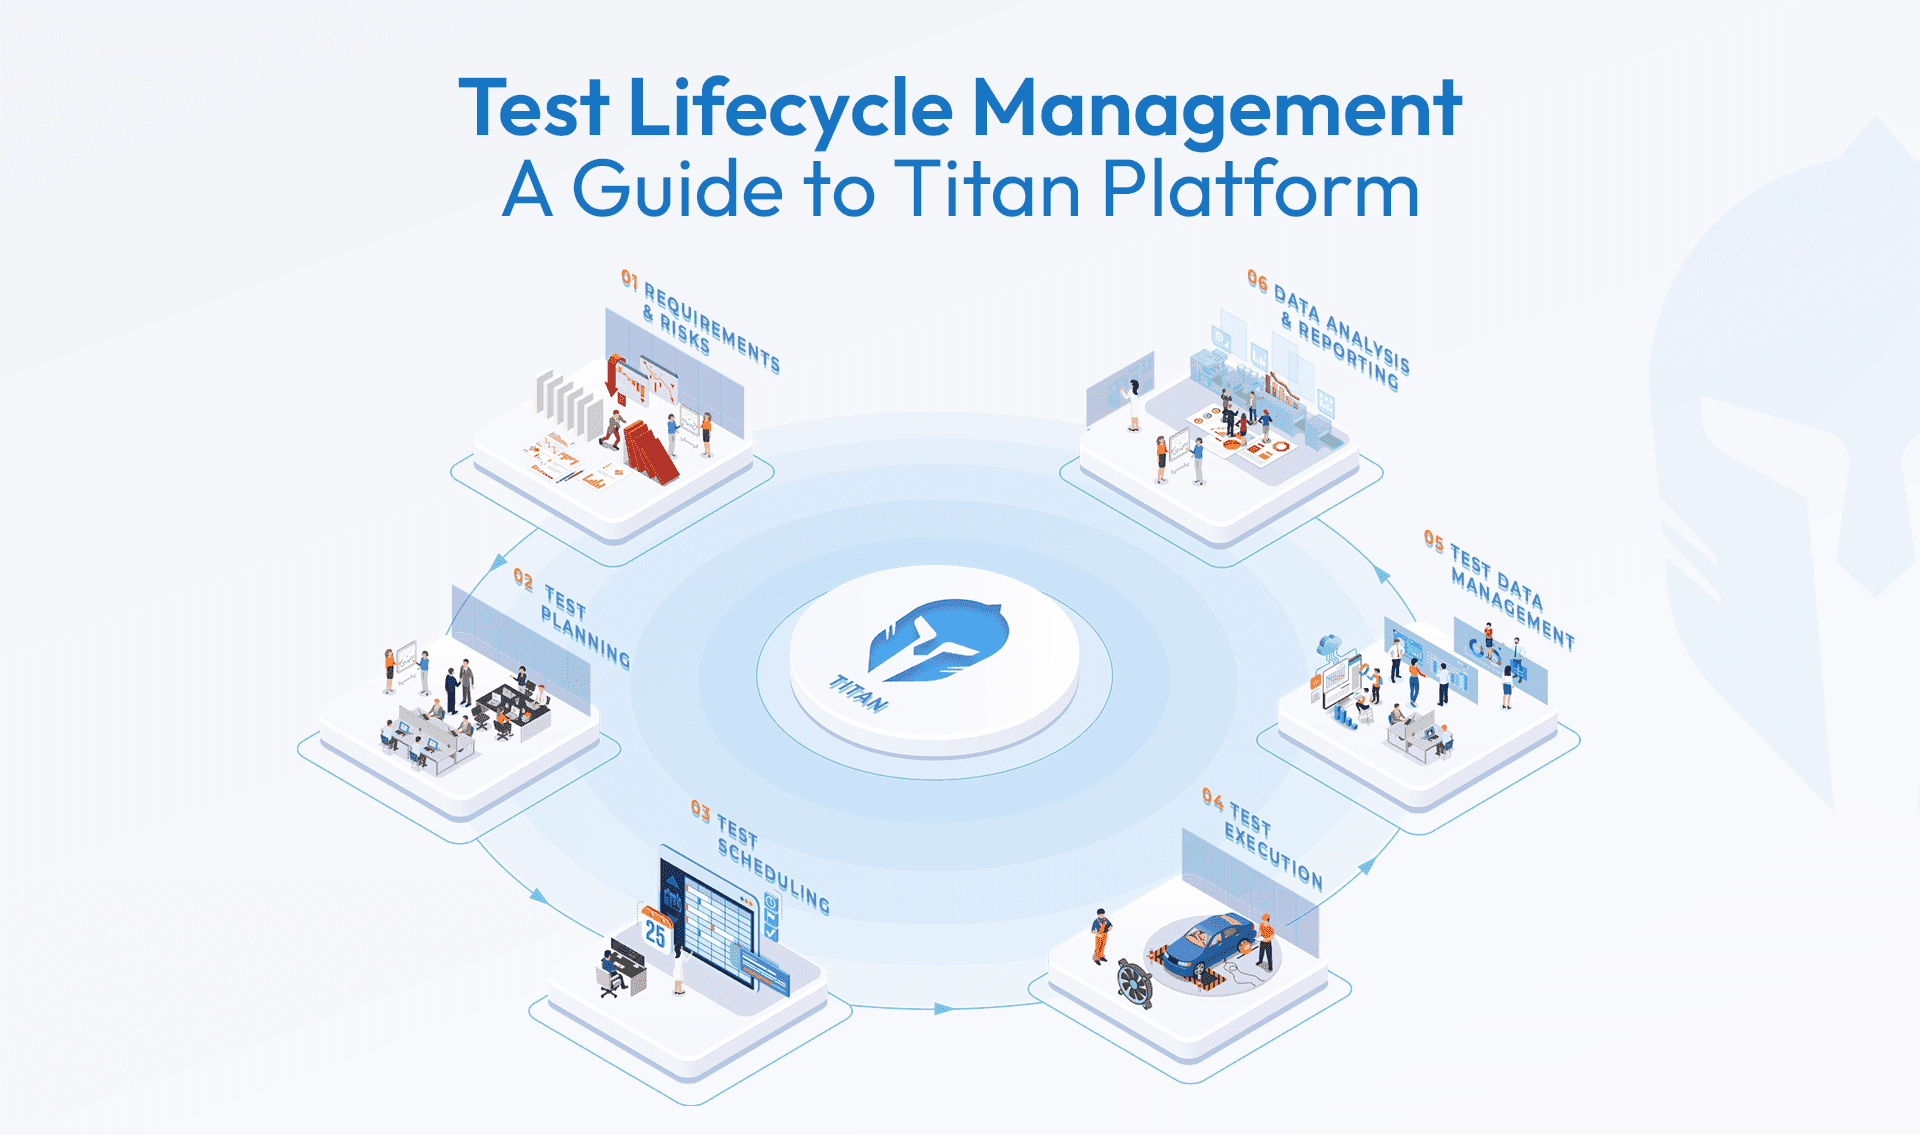
Test Lifecycle Management Explained: What Every Engineering Team Needs to Know
When it comes to product development, testing is more than a box to check it’s the process that validates safety, performance,
Read more...
Can your booking tool do more than just schedule?
Titan's Booking Portal does more than just schedule. It’s a single platform that links test requests,
Read more...
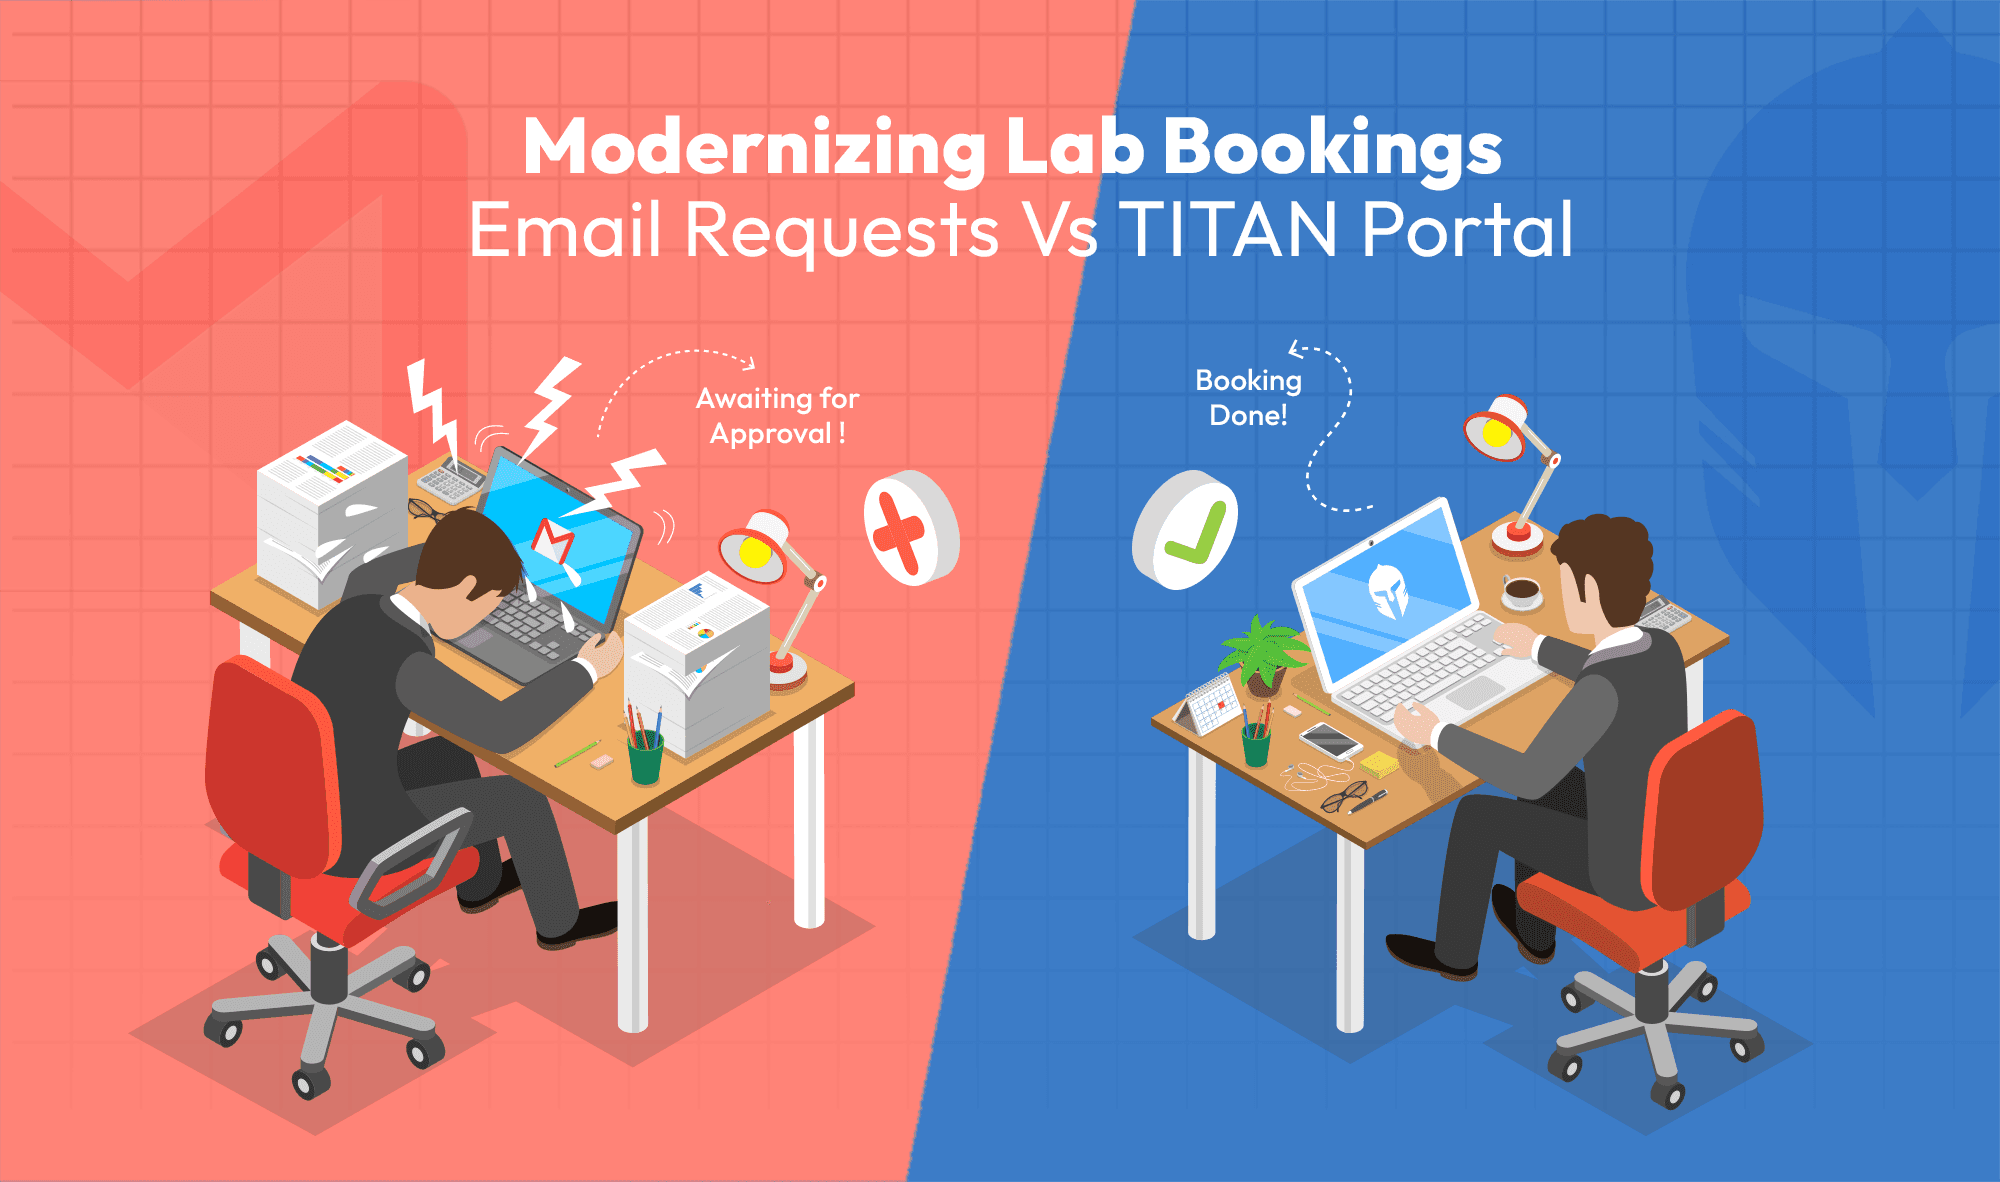
Modernizing Lab Bookings: Email Requests vs. Titan Portal
When managing test labs or proving grounds, it’s common to rely on email threads and manually filled forms from customers
Read more...
Titan for Greenfield OEMs: Managing the Complete Test Lifecycle Beyond Your Walls
Building a product from the ground up as a Greenfield OEM comes with unique challenges.
Read more...
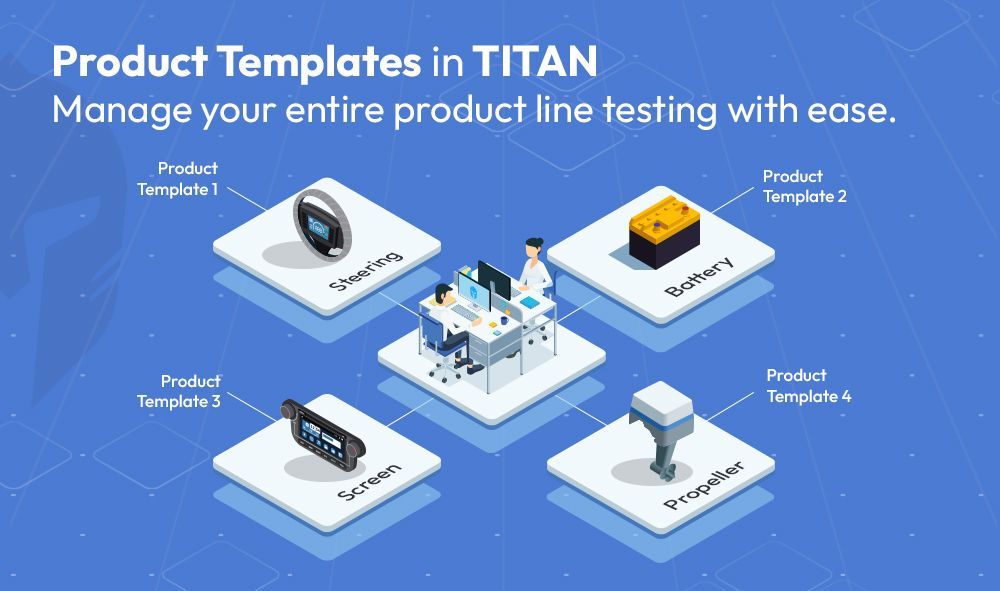
How Titan’s Template-Driven Approach Simplifies Multi-Product Line Test Management
Engineering teams managing diverse product lines often face the challenge of maintaining consistency,
Read more...

How TITAN Supports Laboratories in Achieving ISO/IEC 17025 Compliance
Laboratories across industries are tasked with ensuring the highest standards of testing and calibration.
Read more...

Managing Test Articles Seamlessly with Titan - from Creation to Retirement
In the world of product testing, managing prototype samples and test articles is often a logistical challenge.
Read more...
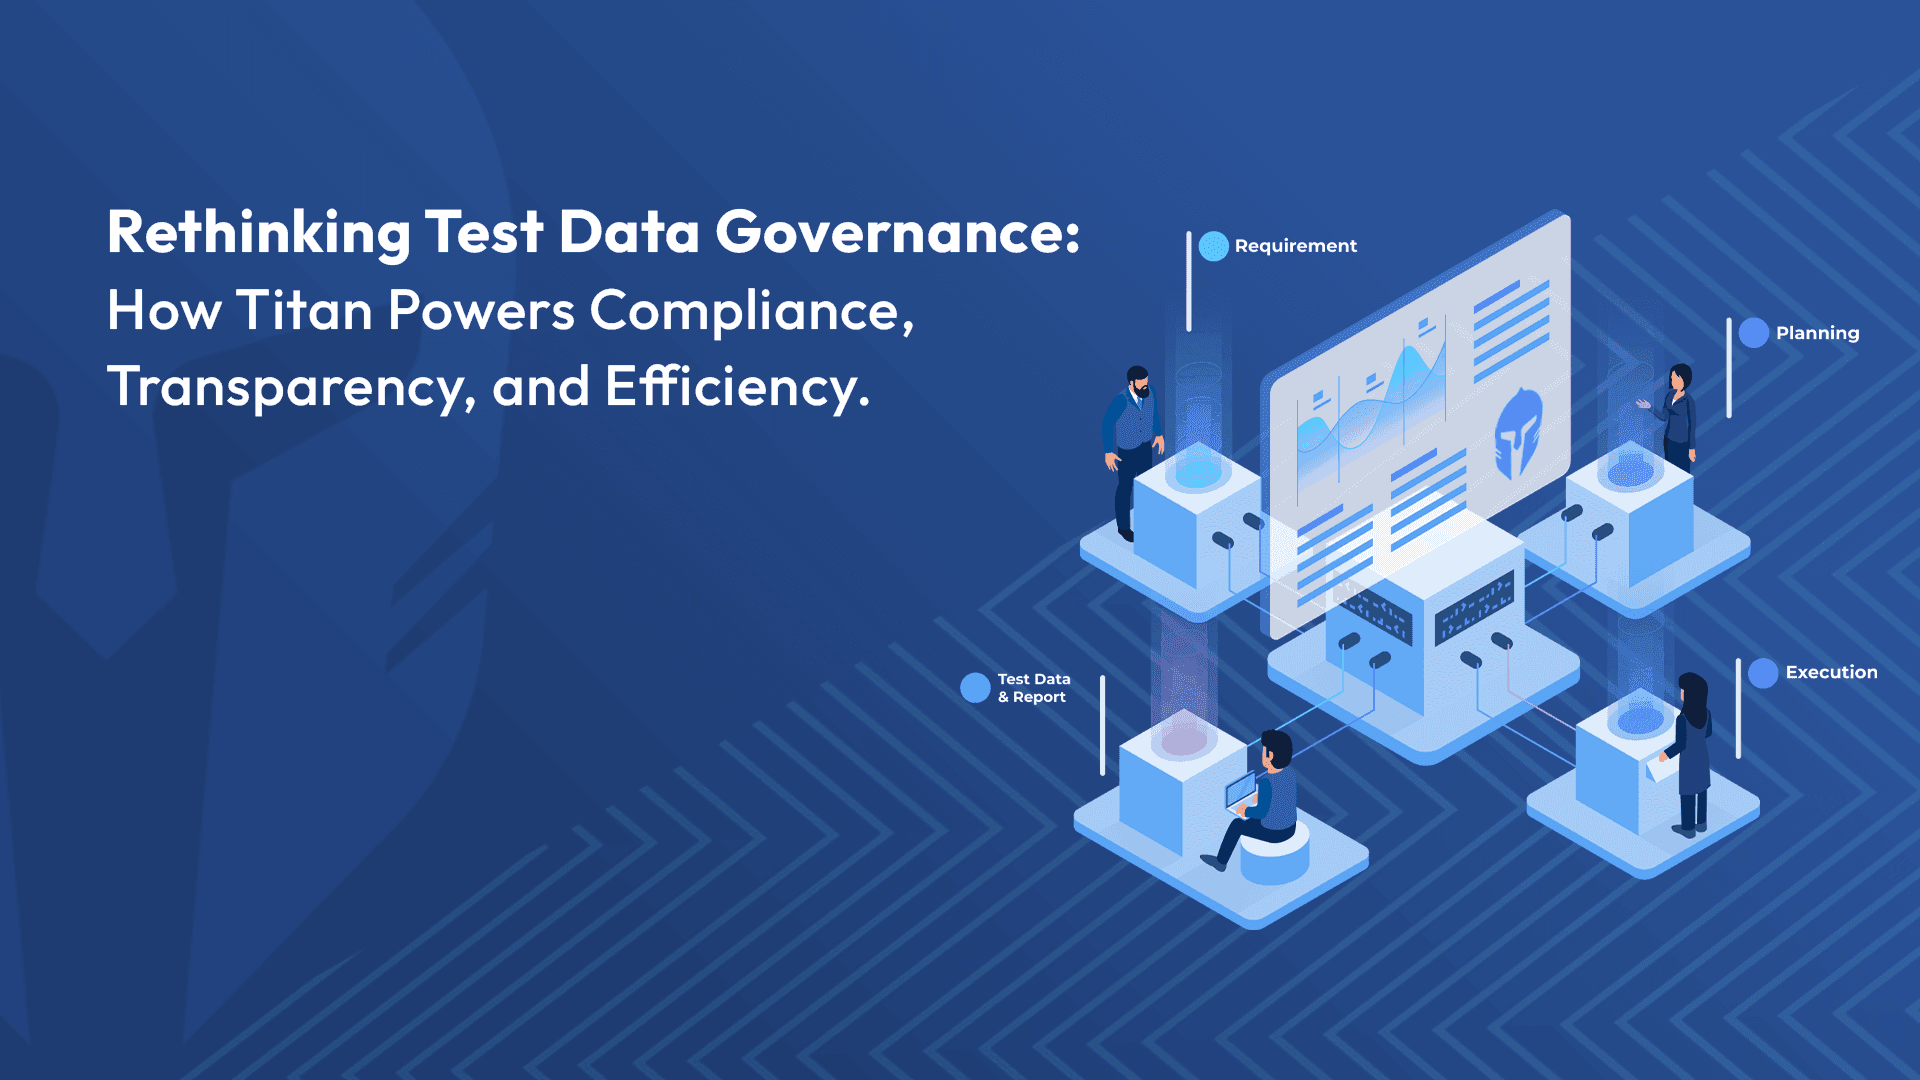
Rethinking Test Data Governance: How TITAN Powers Compliance, Transparency, and Efficiency
In today’s data-driven testing environment, governance leaders face increasing pressure to ensure compliance
Read more...

Bridging the Scheduling Gap for Modern Test Labs: Why TITAN Is Your Lab's Best Ally
Imagine this: A test lab under constant pressure to meet deadlines is struggling with delays and resource conflicts.
Read more...
From Feedback to Feature: The Addition of Inventory Management in TITAN
Over the years, Titan has evolved by listening closely to the needs and feedback of our customers. As a company that values
Read more...
The Essential Synergy: How a unified Test and Lab Management tool enhances your engineering products’ verification and validation experience?
In the world of engineering product verification and validation (V&V), traceability and efficiency are paramount to giving the earliest green signal for a market launch
Read more...
Streamlining Test Management: Best Practices for Effective Scheduling and Resource Allocation
Efficient management of test requests and scheduling is crucial for any engineering or testing department.
Read more...

Transforming Verification Plan Management with TITAN: Overcoming Traditional Challenges
In today’s fast-paced technological environment, managing verification plans (VPs) with outdated tools like spreadsheets or standalone systems....
Read more...
Streamlining Electronics R&D with TITAN's Advanced Testing Features
In the dynamic world of electronics manufacturing, quality isn’t merely a desirable attribute -- it's critical for achieving market success and maintaining customer trust.
Read more...
Eliminate Productivity Killers with TITAN
Administrative tasks are often the silent killers of productivity, diverting engineering teams from their core mission: driving product improvement,....
Read more...
Maximizing Efficiency in Test Management: The Case for Choosing TITAN Over Custom Solutions
You recognize that streamlining and automating your testing processes will enhance quality while reducing costs. As you consider the idea of creating a....
Read more...
Inventory Management– Never Run Out of Consumable Material Again with TITAN!
In addition to its full end-to-end test management capability, Titan also features a robust Inventory module. Now you can manage all the consumable items that....
Read more...
Preventive Maintenance – Another Great Feature from TITAN!
A testing team understands that it is only as good as its equipment. If equipment is neglected -- or maintained incorrectly -- the organization is at risk,....
Read more...

TITAN: An Engineer’s Ally
Greetings fellow engineers, we're excited to introduce your new ally, dedicated to your work satisfaction. Over the years, we have had meetings and discussions ....
Read more...
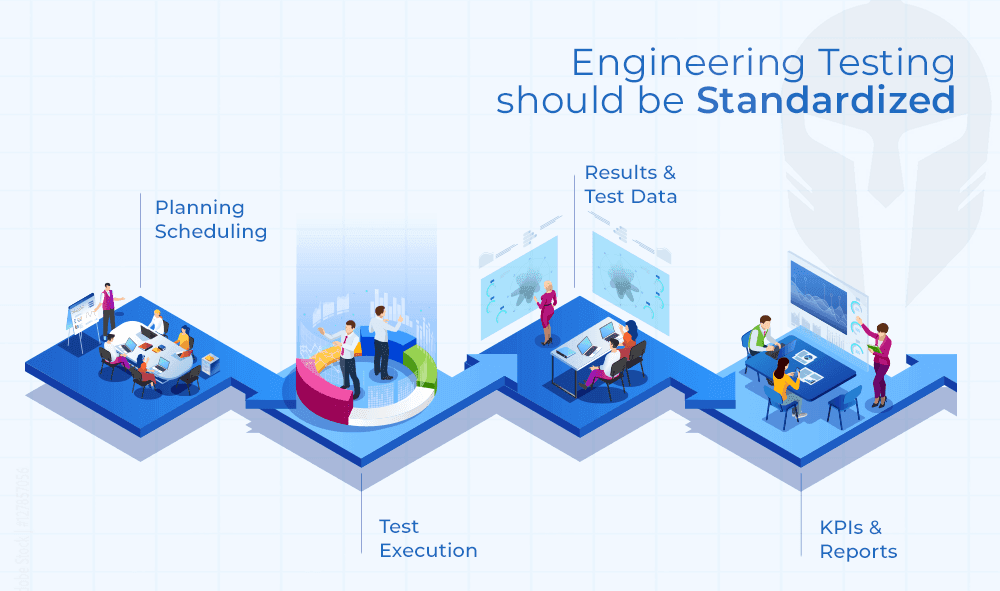
Standardization: Engineering Testing Should Be Standardized, too!
Engineering and IT executives are continually on the hook to deliver savings while streamlining processes and improving quality....
Read more...
Meeting the Crash Testing Challenge
You get one chance to get a crash test right. There are no do overs. You need to ensure every step has been followed meticulously, checked and double checked....
Read more...
DVP Essentials: How TITAN Guarantees Comprehensive Test Coverage with Enhanced Product Quality
In today's fast-paced manufacturing landscape, product success relies on robust design and validation processes. Rushing products to market can lead to....
Read more...
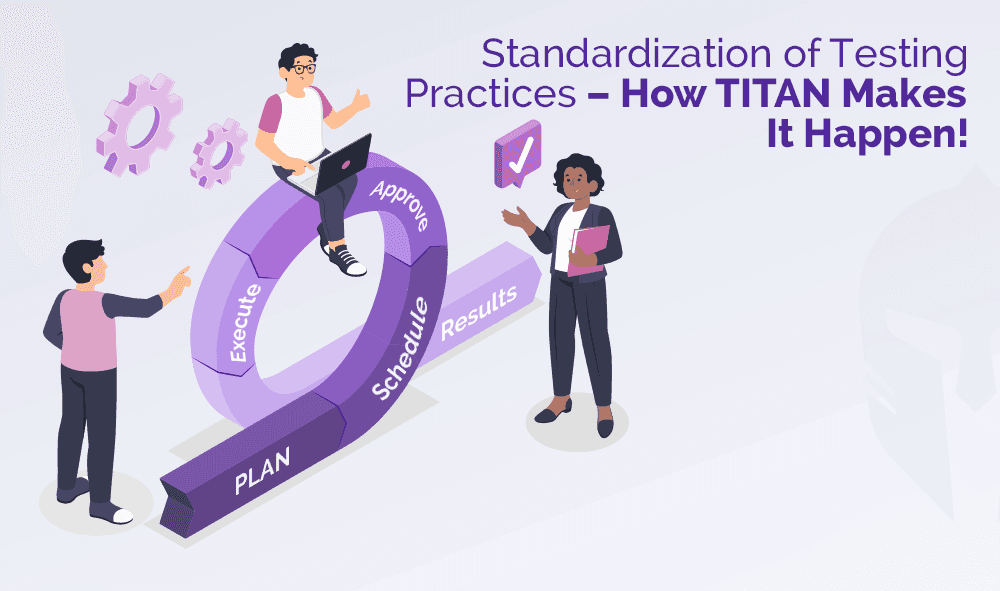
Standardization of Testing Practices – How TITAN Makes It Happen!
Enforcing corporate-wide standardization is a challenge. Over the course of doing business, each engineering department has developed specific testing processes....
Read more...

How TITAN provides Flexibility and Configuration Options for your Unique Workflows ?
When it comes to testing, every organization has its own distinct processes, workflows, and requirements. One-size-fits-all solutions often fall short of....
Read more...

I love making reports. Said NO ENGINEER. EVER.
Every engineer procrastinates preparing a test report as the efforts are high and it consumes lot of his engineering hours. Having said that, test reports remain critical....
Read more...

Challenges in Autonomous Vehicle Testing and Validation
A study, prepared by Strategy Analytics, predicts autonomous vehicles will create a massive economic opportunity that will scale from $800 billion in 2035....
Read more...
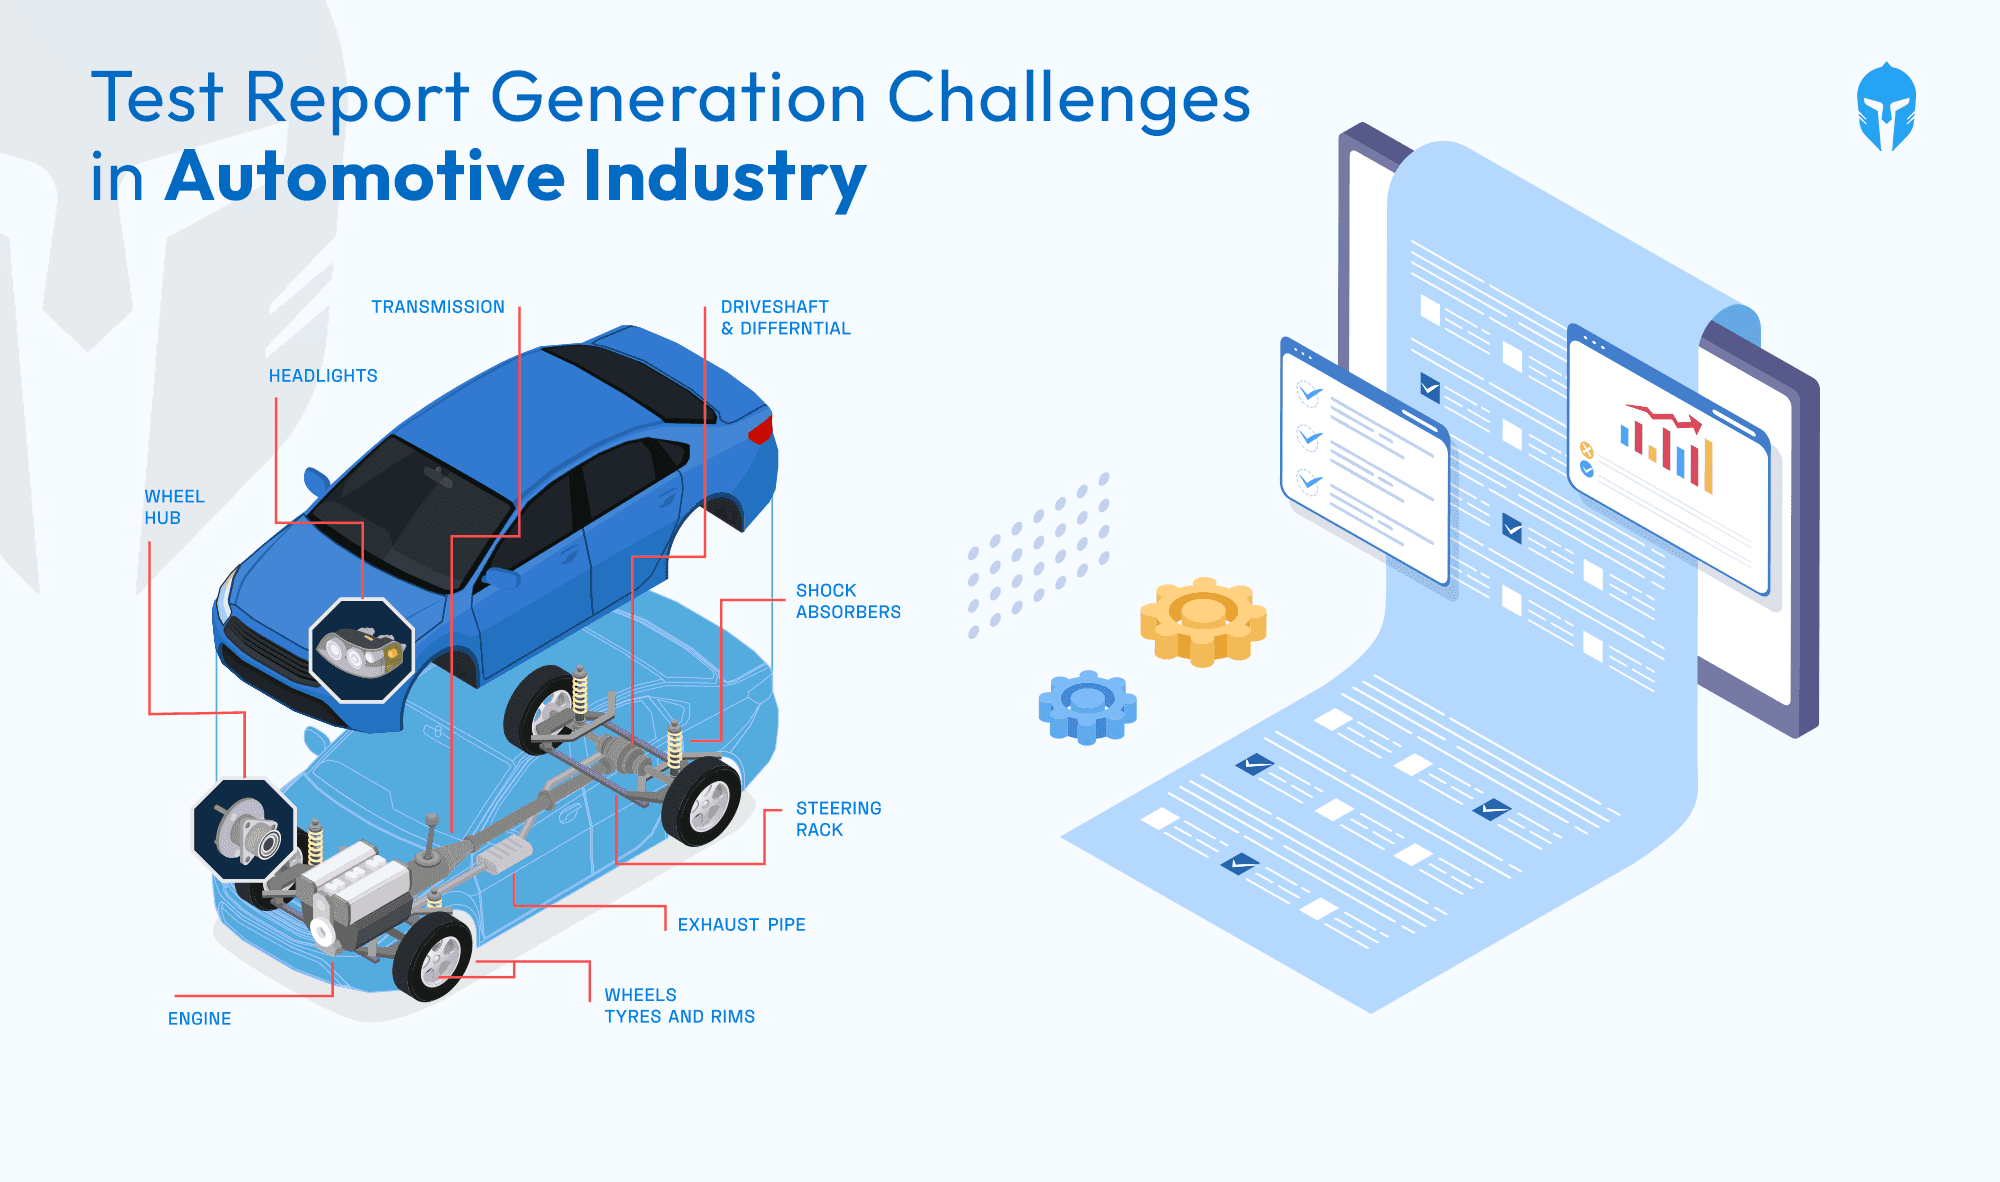
Test Report Generation Challenges In Automotive Industry
Ever wondered how the wheels of vehicle development keep turning smoothly? In the fast-paced realm of vehicle development, where informed decisions....
Read more...

Need For Prototype Vehicle Management System
Prototype testing has been around for as long as humans have been inventing. Creating the best version of a tool requires trial and error, and without testing,...
Read more...
A Complete Guide: Crash Testing For Automobile
A Complete Guide: Crash Testing For Automobile Road accidents are the major cause of death worldwide, even after strict rules and heavy...
Read more...
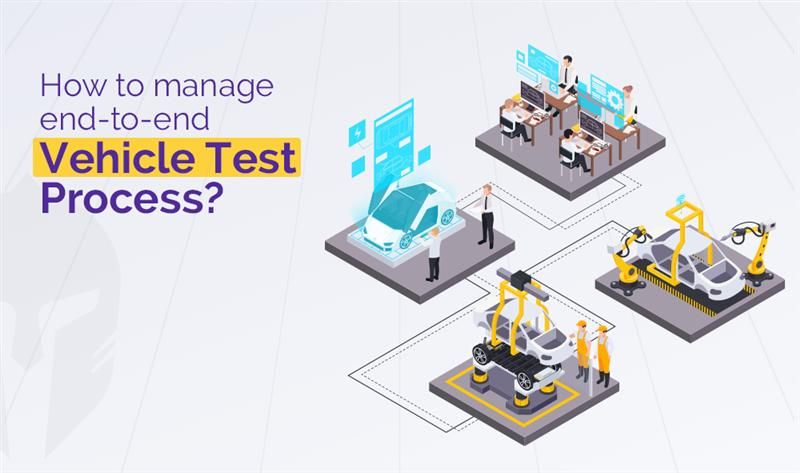
How To Manage End-To-End Vehicle Test Process
How To Manage End-To-End Vehicle Test Process Testing Beyond Boundaries With TITAN TITAN has established itself as a leader in vehicle...
Read more...
Test Incident & Concerns Management
Test Incident & Concerns Management In developing any new product, you invest a great deal of time and energy into testing your products...
Read more...

Why do you need Test Lifecycle Management
Why do you need Test Lifecycle Management We’re living in a time period where we have integrated software tools and apps into every...
Read more...